Discovering and reusing connectivity knowledge in flatmaps
This tutorial provides a step-by-step guide to help you find, explore, and reuse connectivity knowledge in flatmaps. It includes instructions on navigating maps, searching for connections, interacting with connectivity data, and saving connectivity information effectively.
Find a Connection
Visually on the Map
Navigate to the map of interest. Once on the correct map, identify and select the desired connection using the following steps.
- Zoom in and pan across the map to locate areas of interest.
- Hover over connections to see their labels.
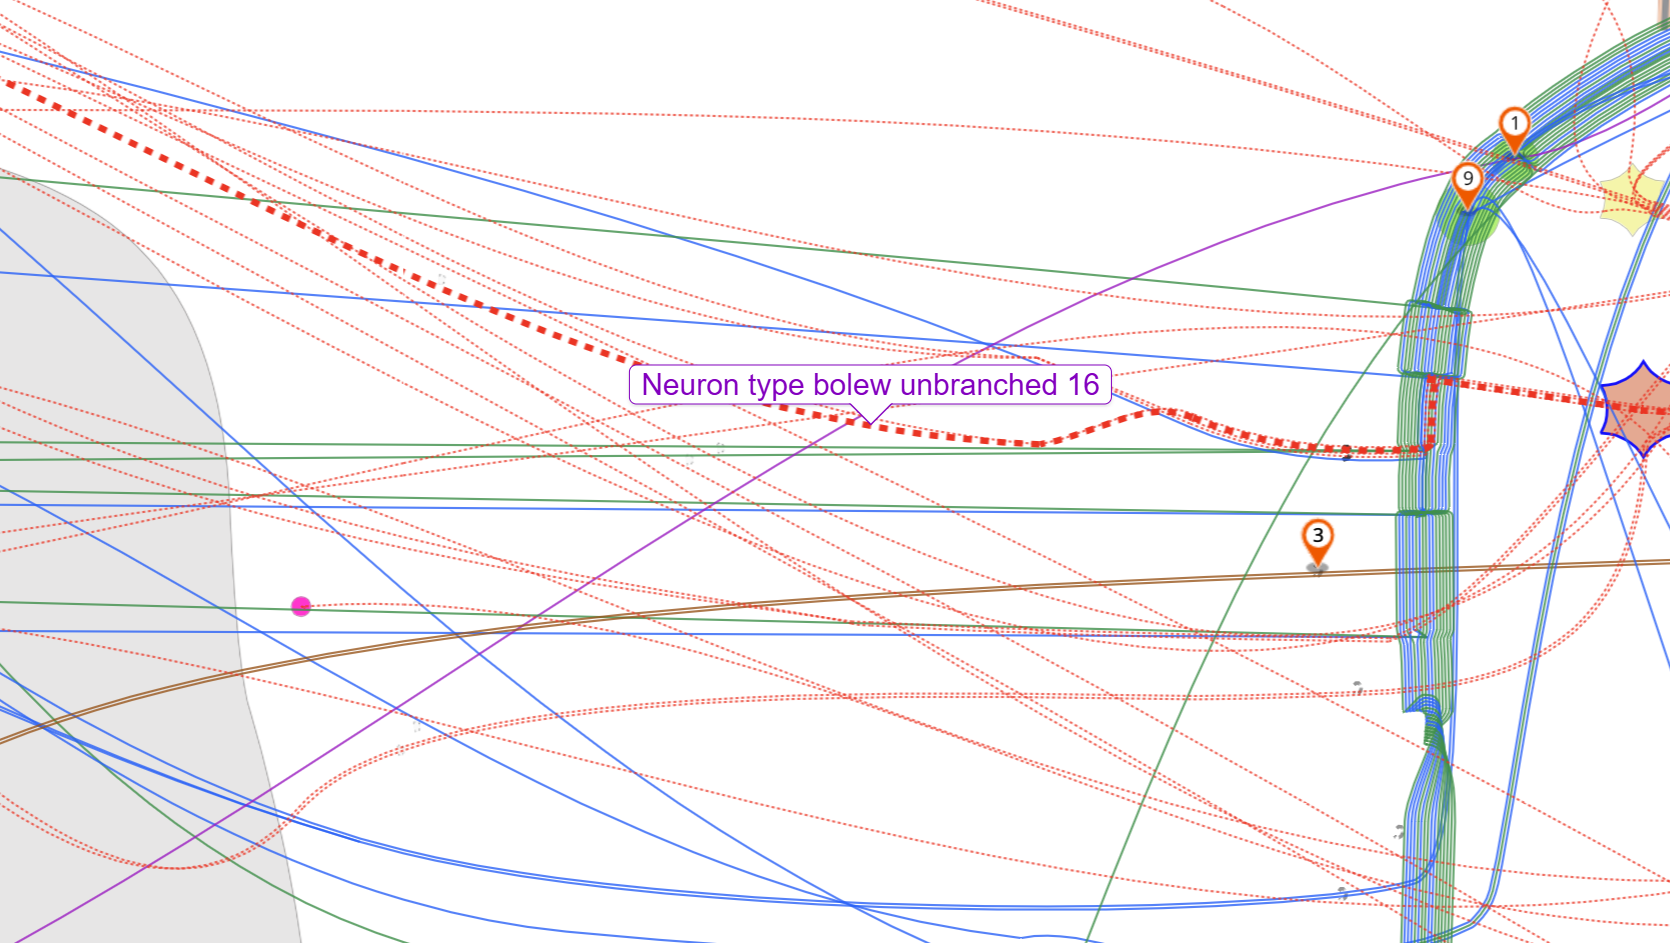
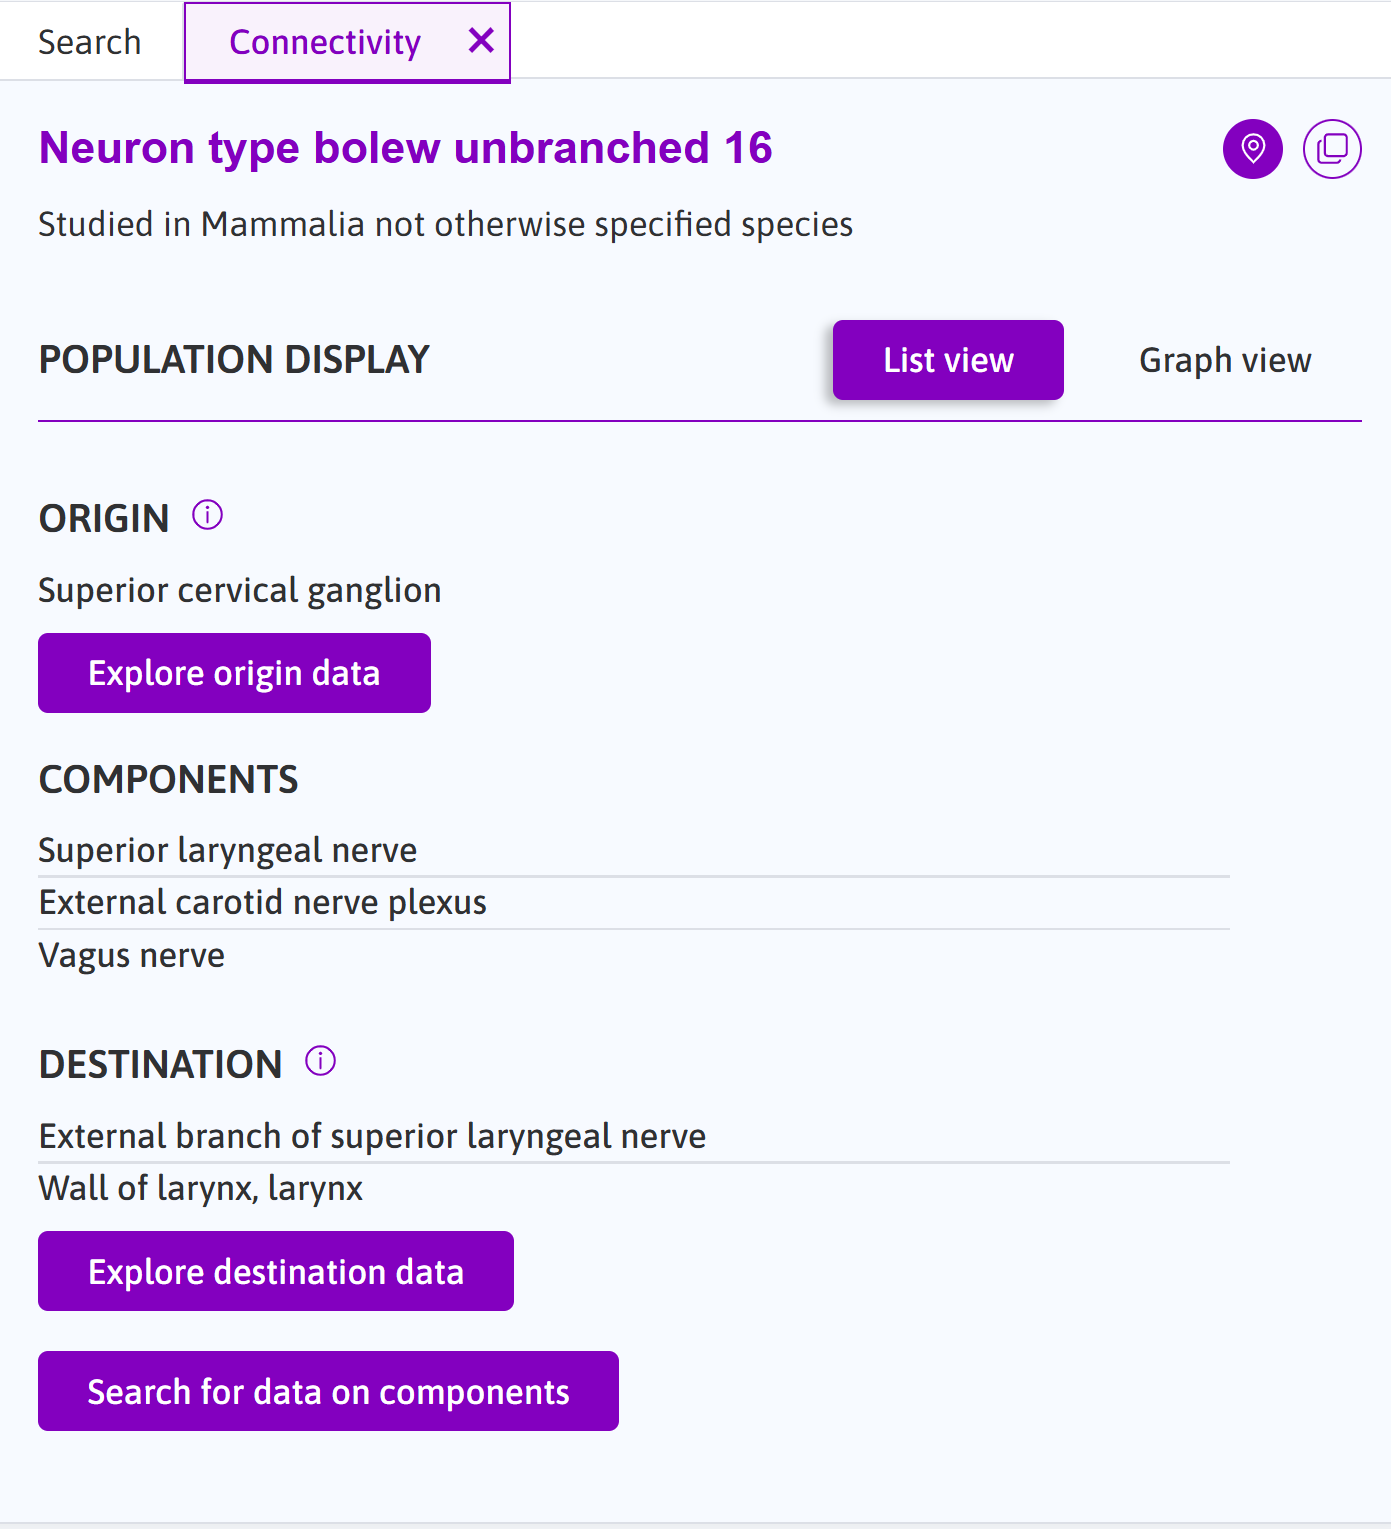
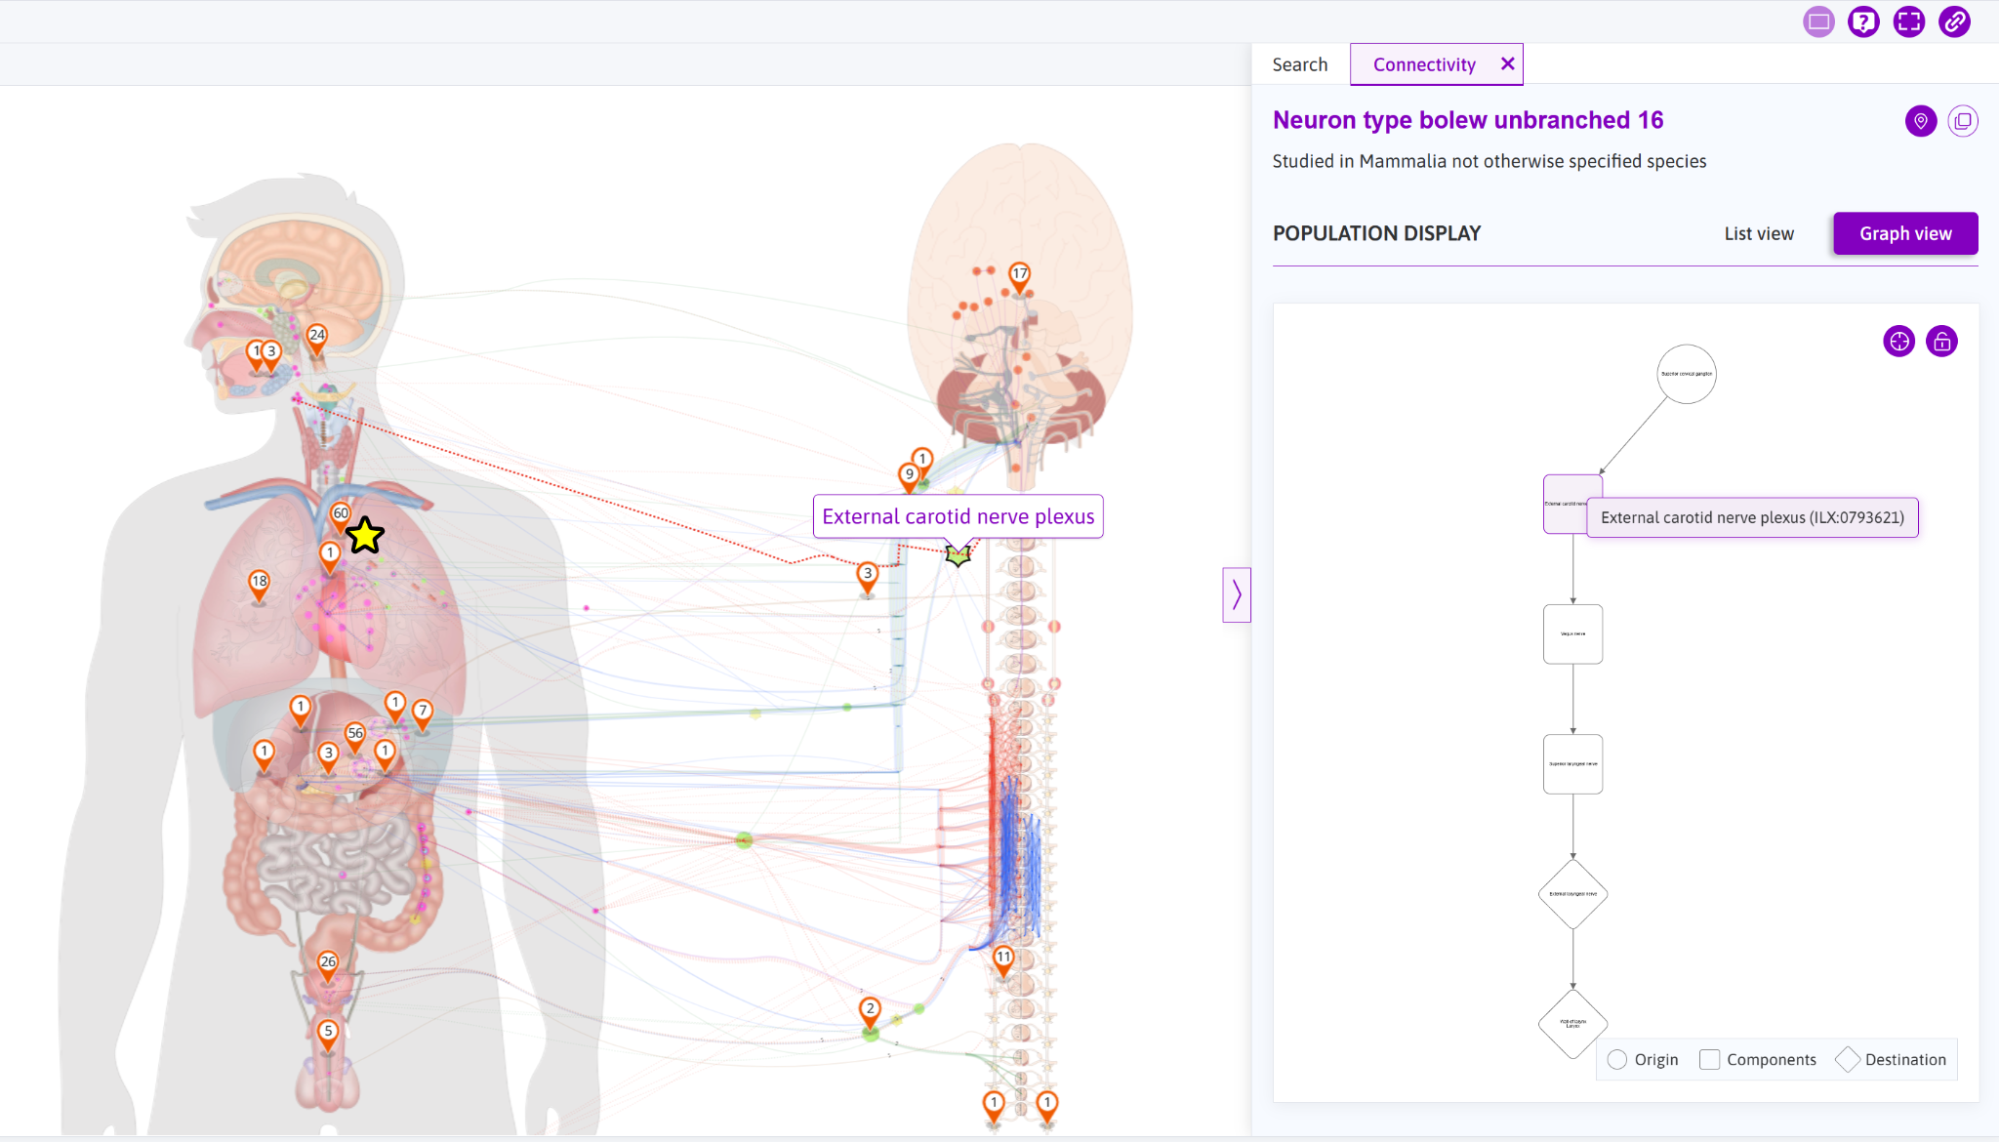
The "Neuron type bolew unbranched 16".
- Click on the connection to open the Connectivity Sidebar. The Sidebar is your main hub for viewing detailed connectivity information. It provides quick access to origins, components, destinations, and relevant references. For example, the figure below shows the "Neuron type bolew unbranched 16" with its connectivity details displayed in the sidebar.
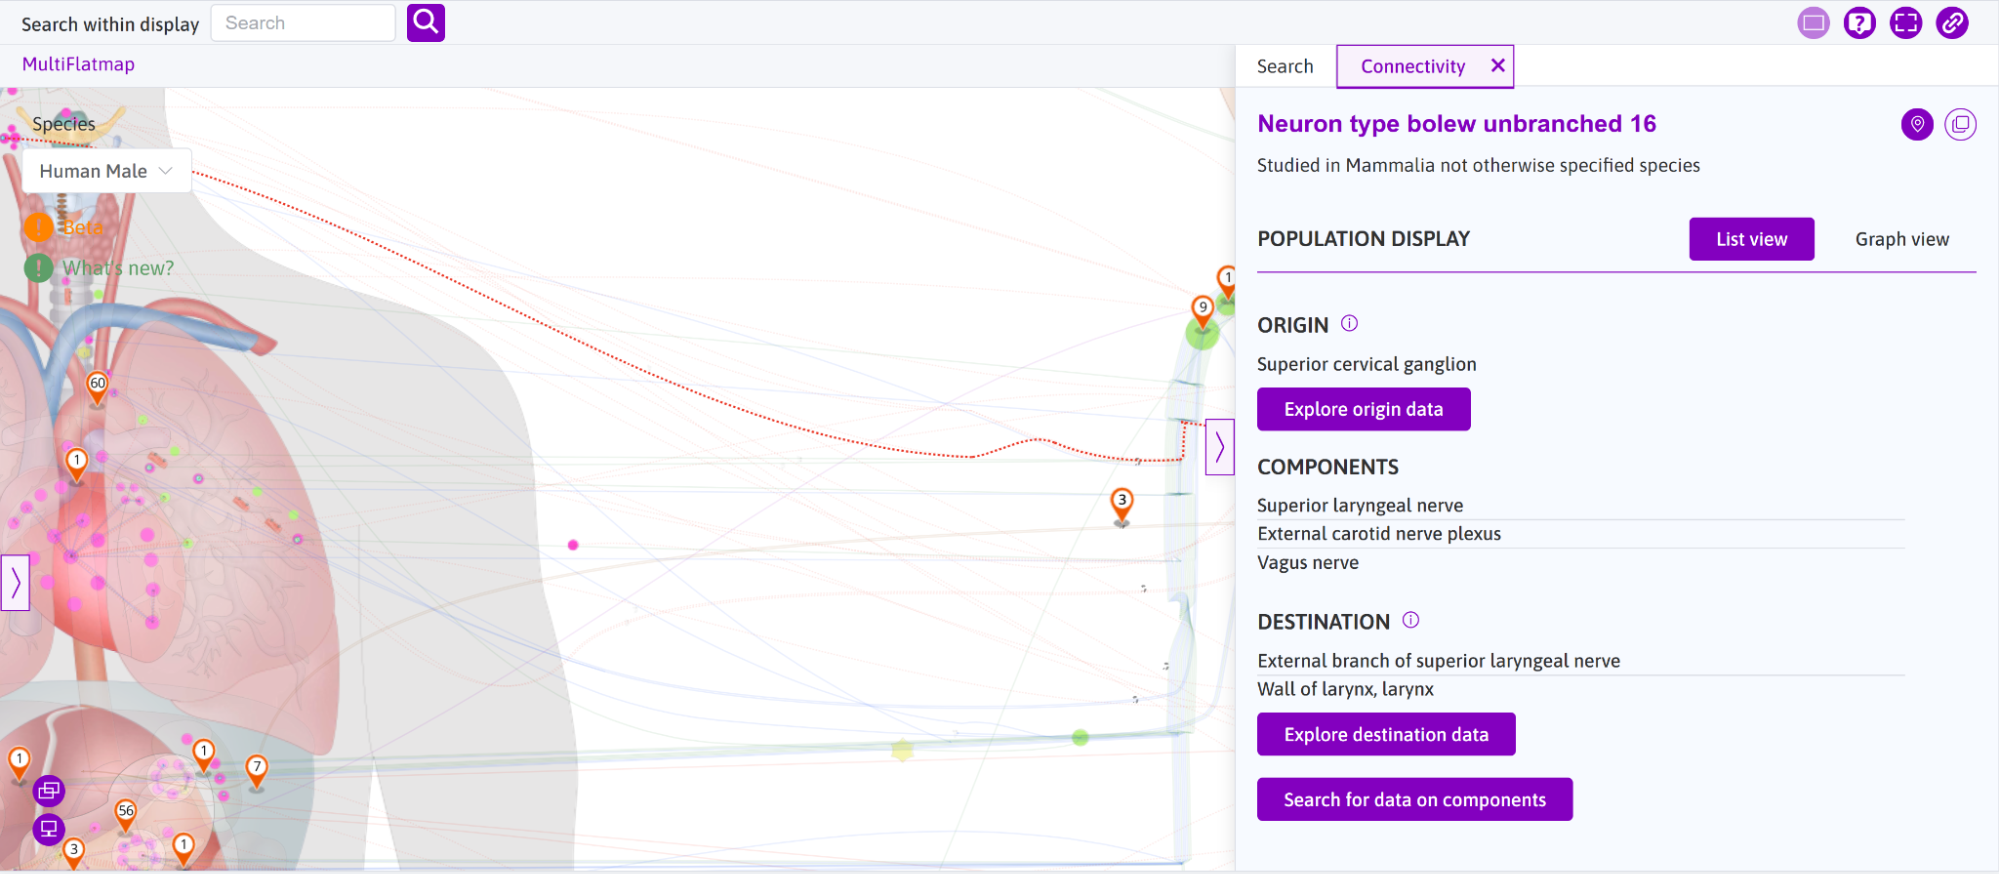
The selected connection "Neuron type bolew unbranched 16" with detailed information shown in the sidebar.
Search on the Map
- Use the search bar at the top of the map interface.
- Enter keywords related to the connection or anatomical structure you are looking for in the currently displayed map(s).
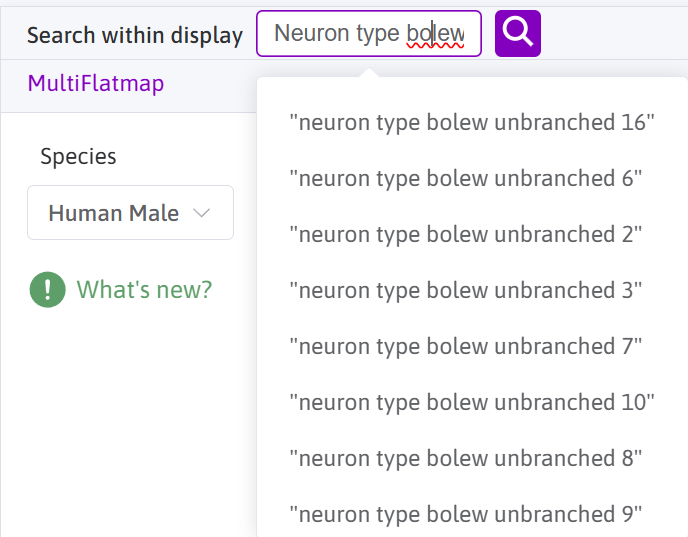
The dropdown search results for the query 'Neuron type bolew unbranched'.
- Review the dropdown results and click the desired item to navigate directly to it on the map. The map will automatically focus on the selected connection for further exploration.
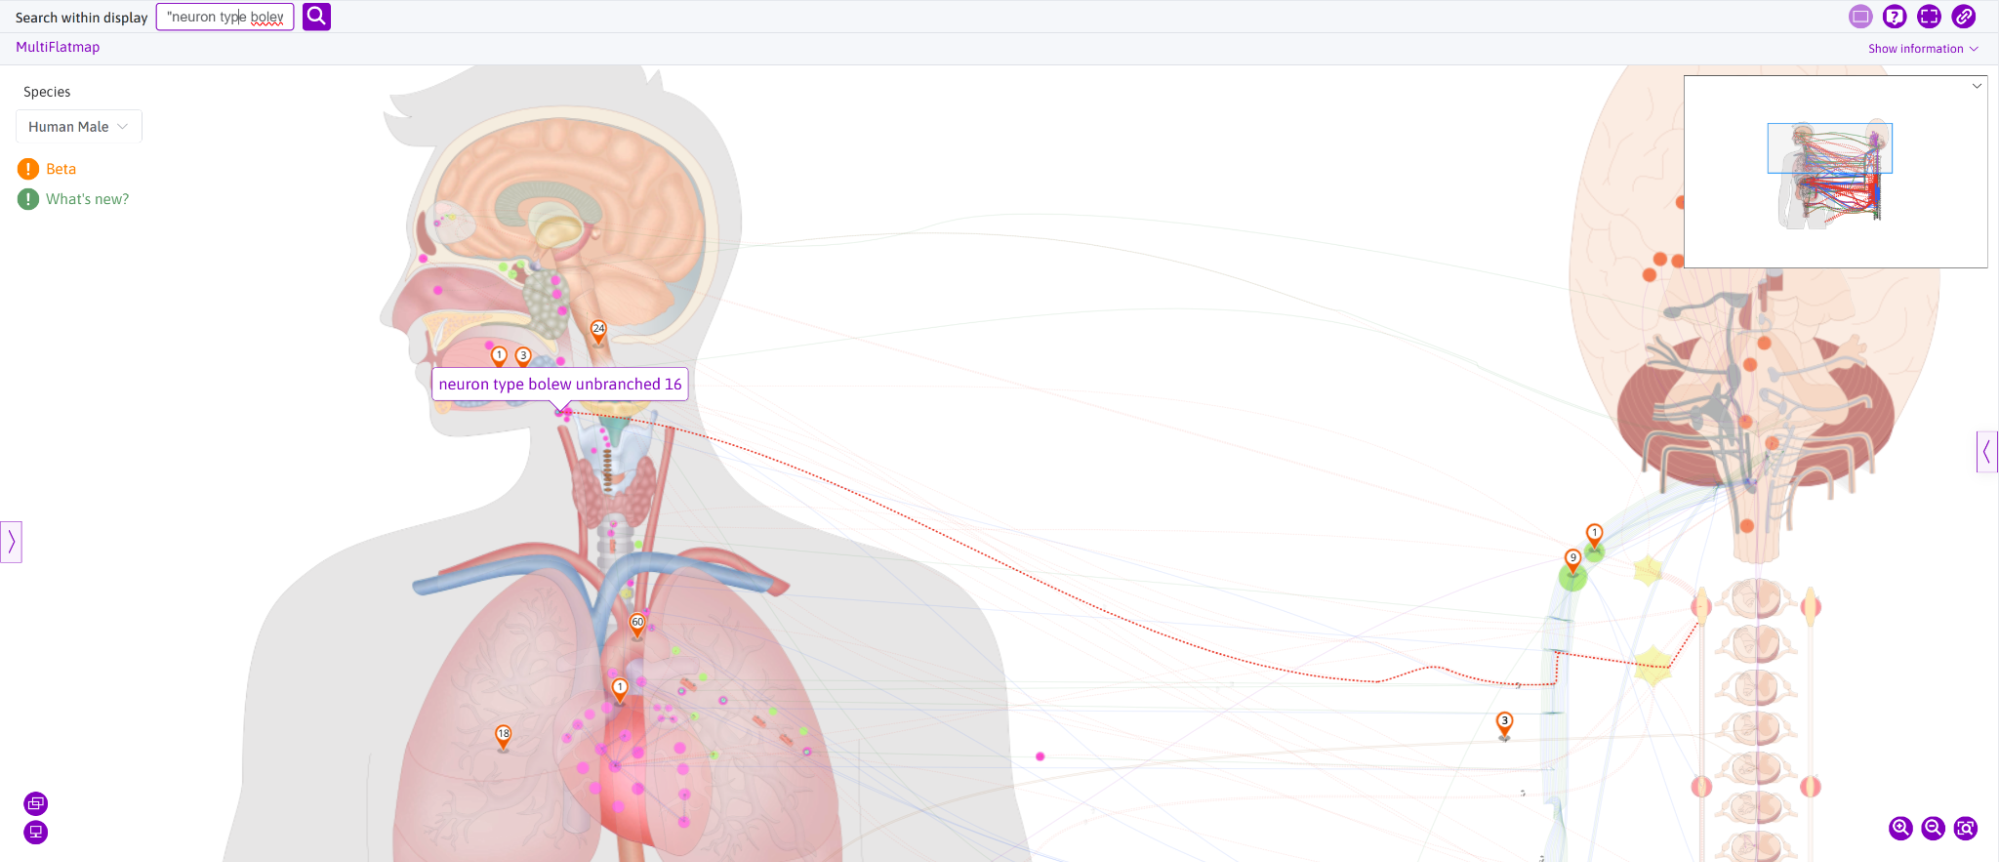
The selected search results highlighted on the map.
Explore Connectivity Information
The connectivity information displayed in SPARC flatmaps is derived from the SPARC Connectivity Knowledge Base of the Autonomic Nervous System (SCKAN). SCKAN is a key component of the SPARC Program, serving as a centralized semantic store for comprehensive, machine-readable knowledge of autonomic and peripheral nervous system connectivity. It integrates data from SPARC experts, literature, textbooks, and SPARC-specific analyses, enabling advanced queries and linking connectivity information to SPARC models, flatmaps, and simulations. This foundation provides users with detailed routes, targets, and evidence, offering a robust and interconnected knowledge ecosystem. The sources of knowledge for a given connection in SCKAN are displayed in the “References” section of the connectivity sidebar below the “Population Display” section.
In this section, we will demonstrate how to use the List View and Graph View to analyze and navigate connectivity information.
List View
Click on the "List View" option in the population display menu in the connectivity sidebar.
View the organized table of connectivity data, which includes:
- Origins (the location of the initial cell body in the PNS circuit)
- Components (intermediary elements)
- Destinations (where the axons terminate)
The list view of "Neuron type bolew unbranched 16"
Hovering over a row in the table highlights the corresponding feature on the map (if available, see note below).
Hovering over a feature in List View highlights corresponding anatomical features on the map.
Graph View
Select "Graph view" to see a flowchart representation. As shown in the graph legend, the circles represent origins, rectangles show components, and diamonds indicate destinations (as defined in the list view above). Follow the arrows to trace the connection path.
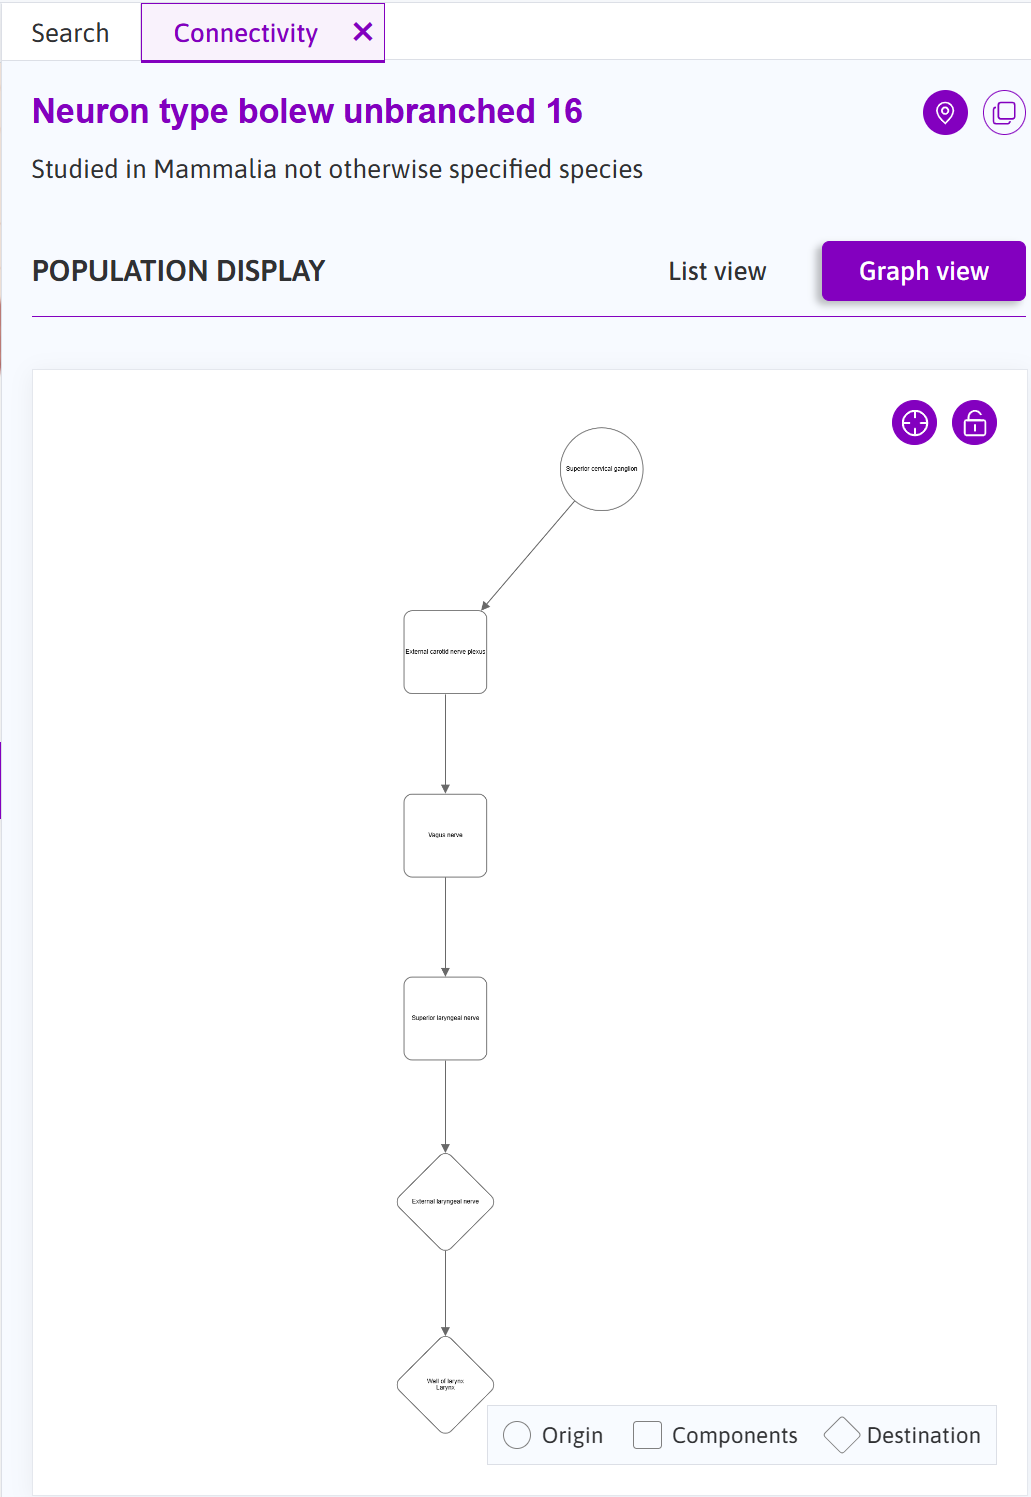
The graph view of "Neuron type bolew unbranched 16".
There are two action buttons in the top right corner to enhance navigation and improve the user experience.
The Reset Position button ( ) restores the graph to its default layout, ensuring a clear view of all nodes and connections. This is especially useful if you've navigated away or zoomed in on a specific section.
The Lock Zoom button ( ) enables a fixed zoom level, preventing accidental zooming in or out while interacting with the graph. Once clicked, the button changes to Unlock Zoom, revealing two additional controls:
- Zoom In: Allows you to magnify the graph for a closer look at specific features.
- Zoom Out: Enables a broader view to see the entire graph context.
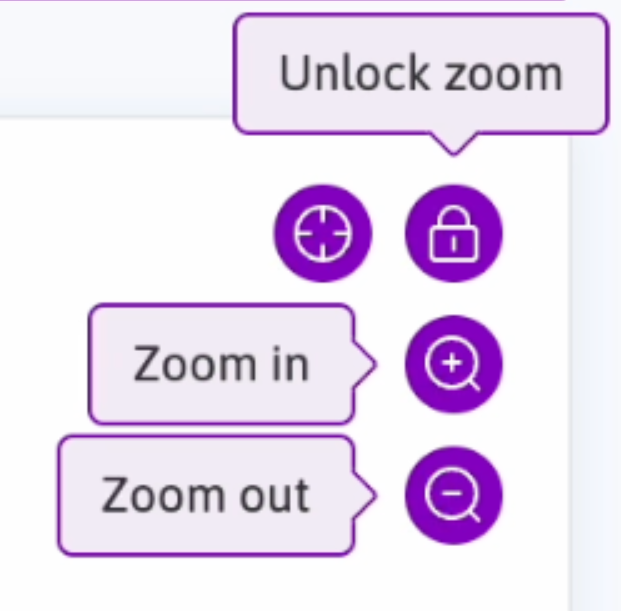
The expanded zoom control interface after clicking "Lock zoom".
Similar to the List View, hovering over nodes in the graph highlights corresponding features on the map (if available).
Hovering over a node highlights corresponding anatomical features on the map.
Note:Not all features displayed in the List or Graph View are represented on the flatmap. This is because the List and Graph Views are currently displaying connectivity descriptions obtained from SCKAN, rather than how the connectivity is rendered or routed on the flatmap.
Interacting with the Maps
Locate Connections
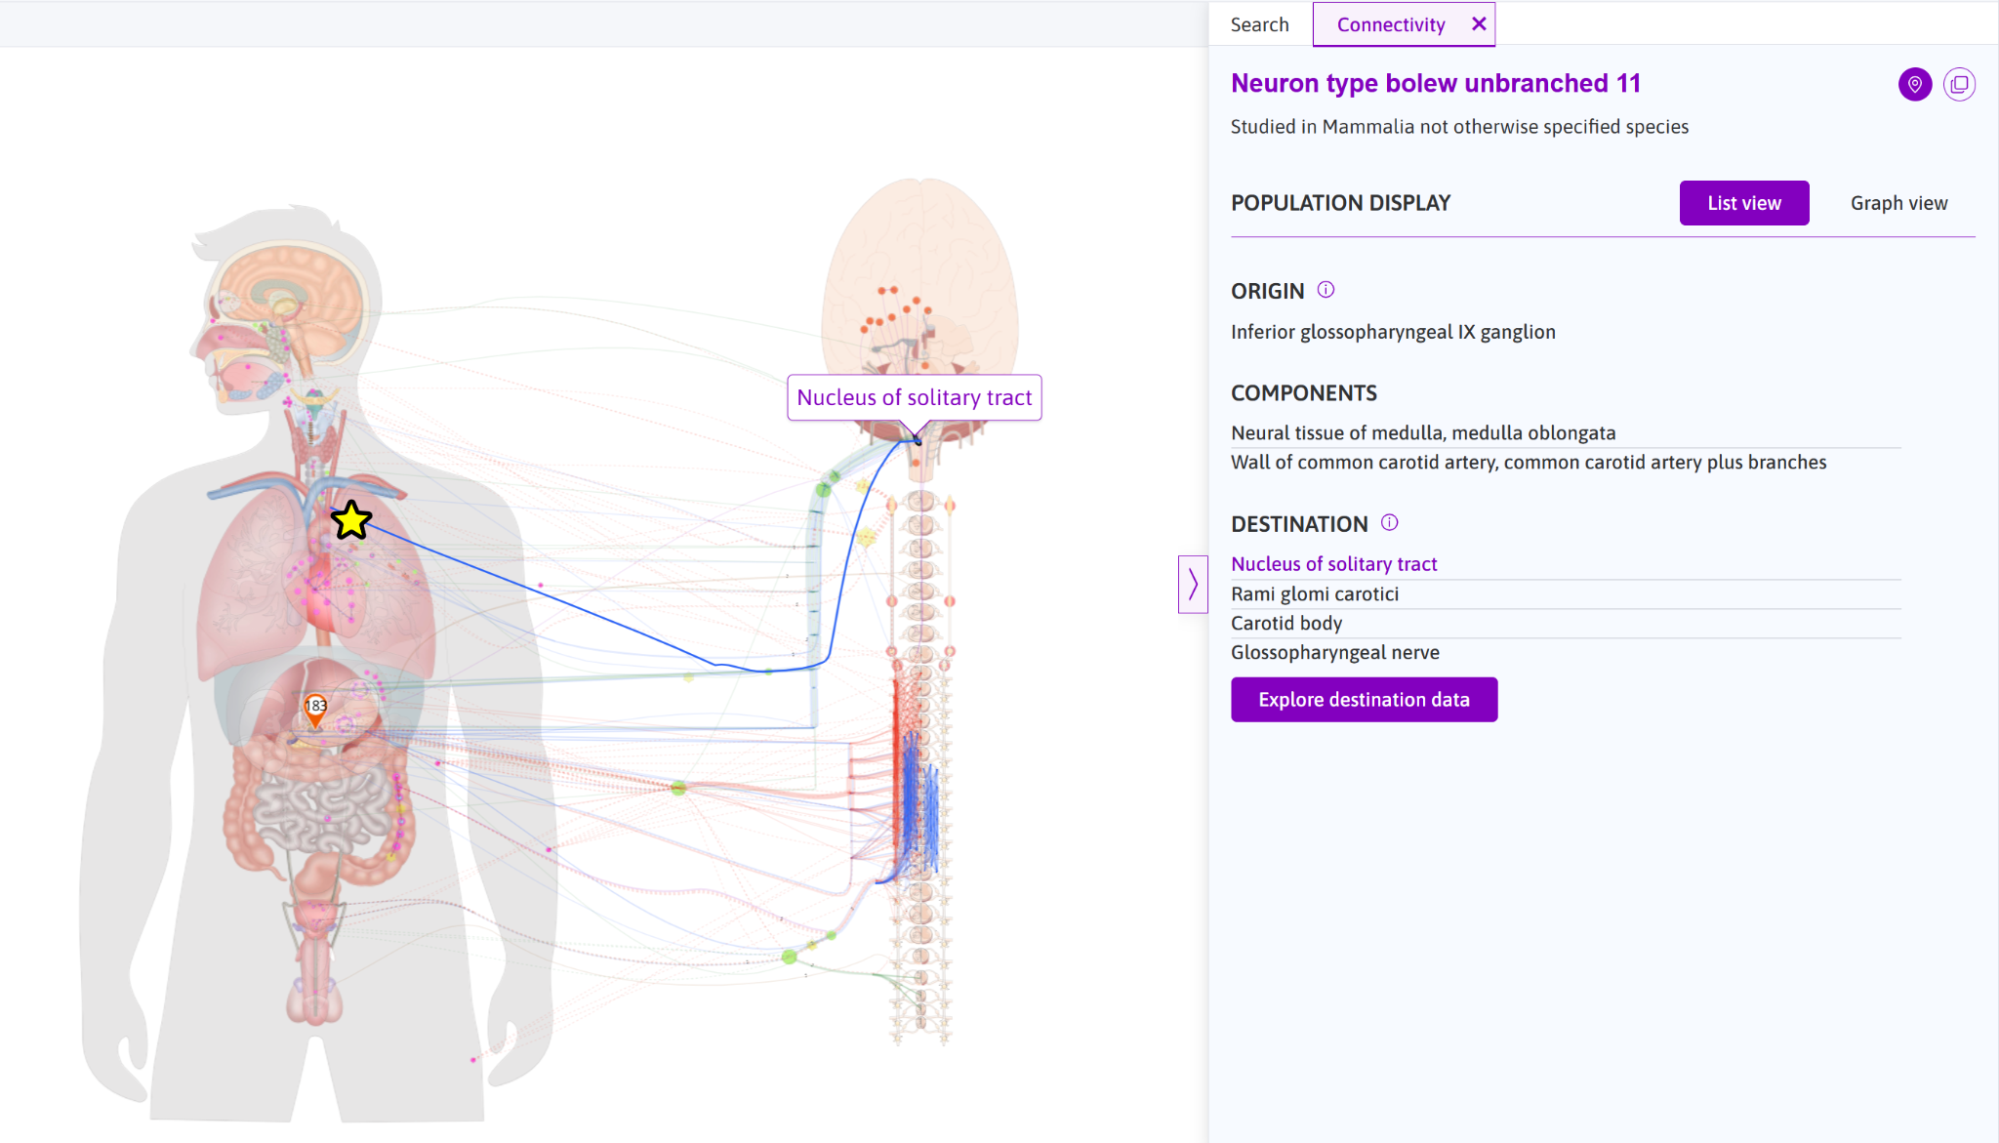
Use the locate icon ( ) in the top right corner of the connectivity sidebar to zoom in and center the selected connection on the map. For example, the figure below shows how the connectivity "Neuron type splen 2" is centered and highlighted after using the Locate feature.
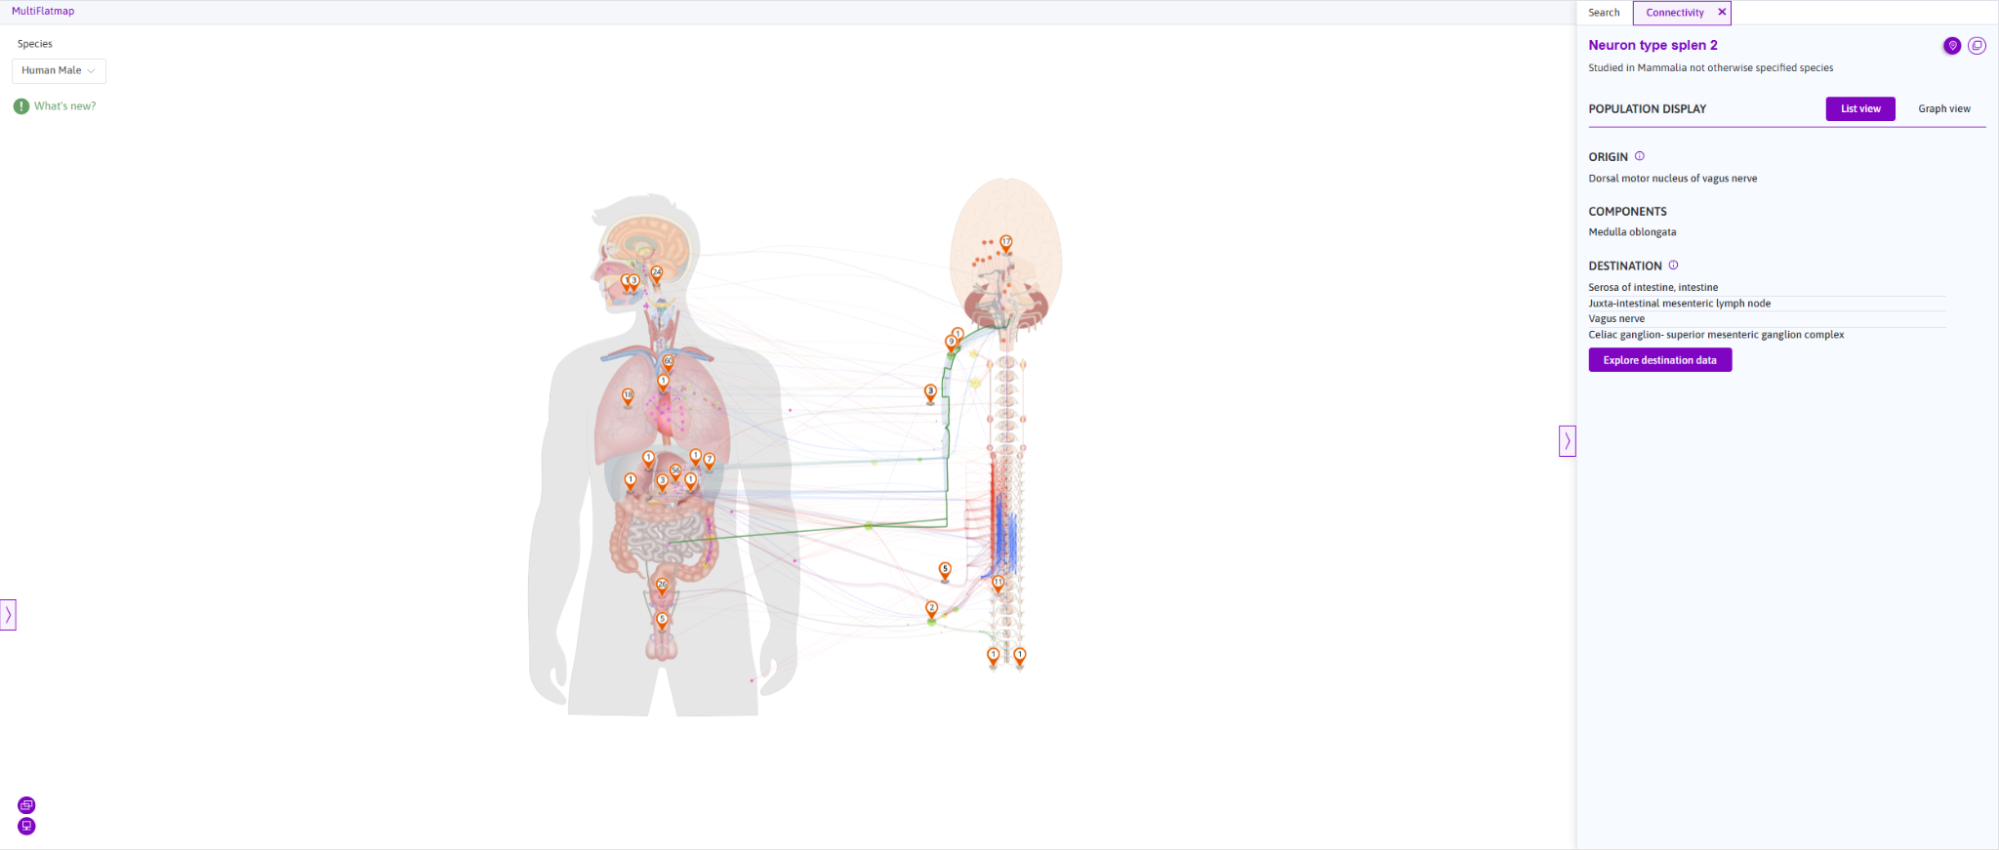
The Locate feature centers and highlights "Neuron type splen 2."
Explore Related Data
In the connectivity sidebar, buttons like "Explore origin data", "Explore destination data", and "Search for data on components" provide quick access to additional information. These buttons navigate to the Search Tab within the same sidebar, displaying datasets related to the anatomical features of the selected connection.
The buttons on the sidebar.
For example, after clicking the "Explore origin data" button, the sidebar shows datasets related to the "Superior cervical ganglion," the origin of "Neuron type bolew unbranched 16."
Cross-check provenance information for deeper insights or validation.
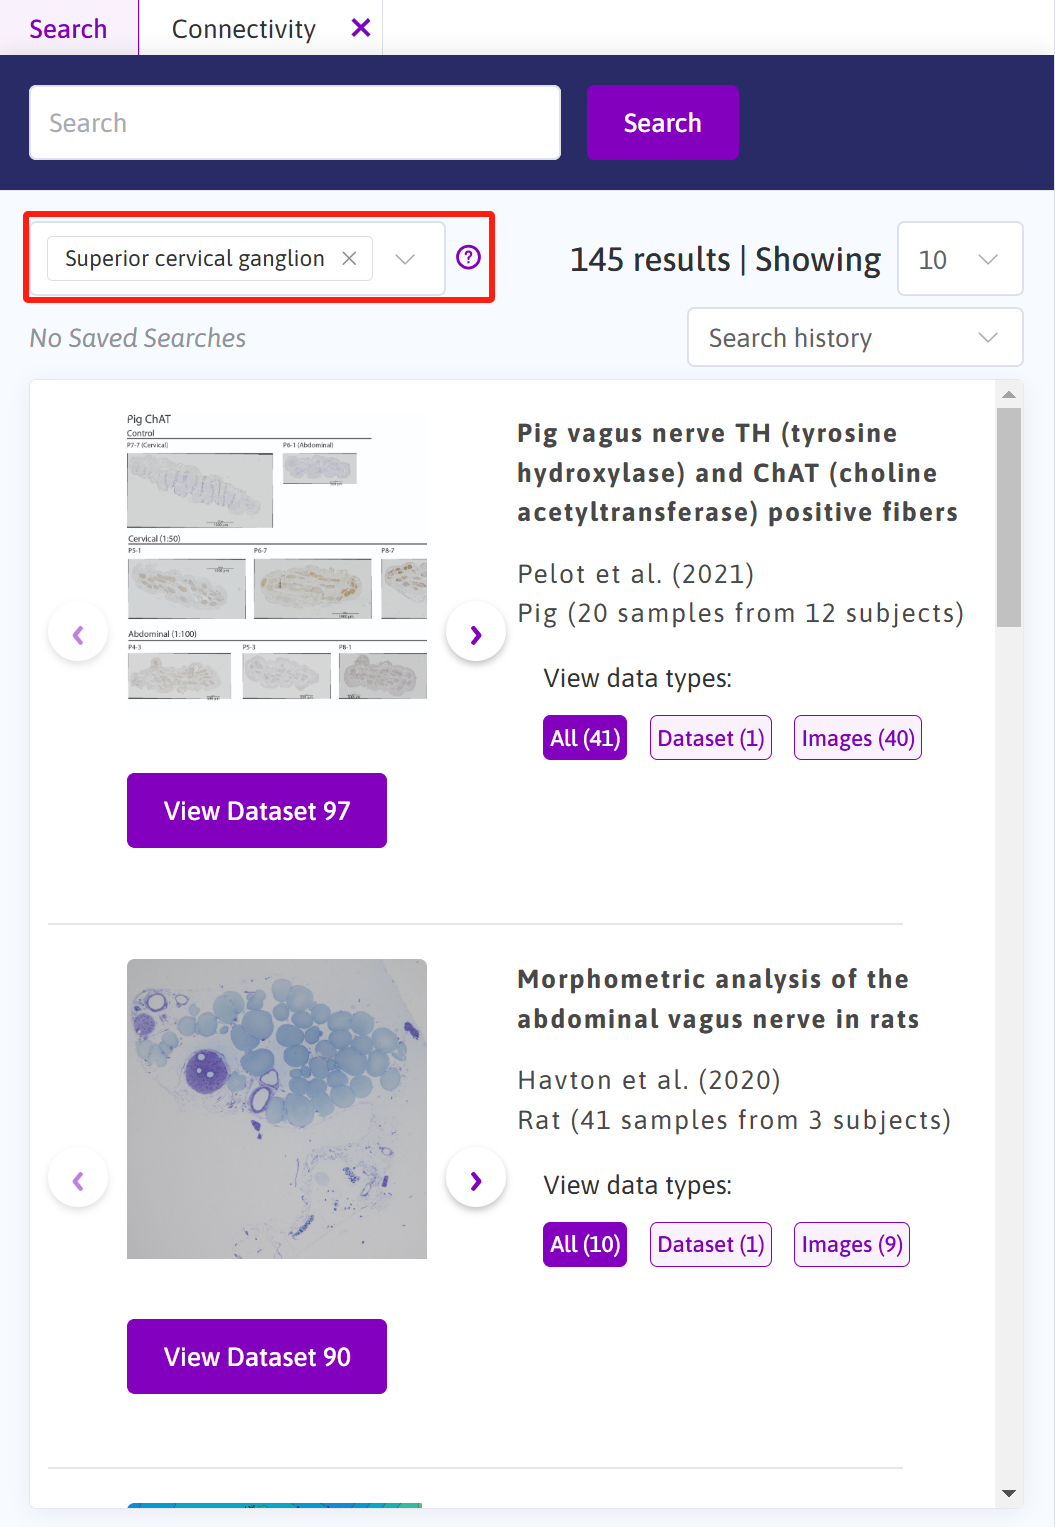
Search results after clicking "Explore origin data."
If you wish to return to the Connectivity Tab and continue analyzing the connectivity information, simply click on the tab labeled "Connectivity" at the top of the sidebar. This will bring you back to the connectivity data view.

The "Connectivity Tab" at the top of the sidebar.
Reusing connectivity information
Connection Details
Using the clipboard icon ( ) in the top right corner of the connectivity tab, the selected connection's information can all be copied to the clipboard. This includes all origin, component, and destination details, as well as the reference list, for pasting into your records, support tickets, etc., or further research.
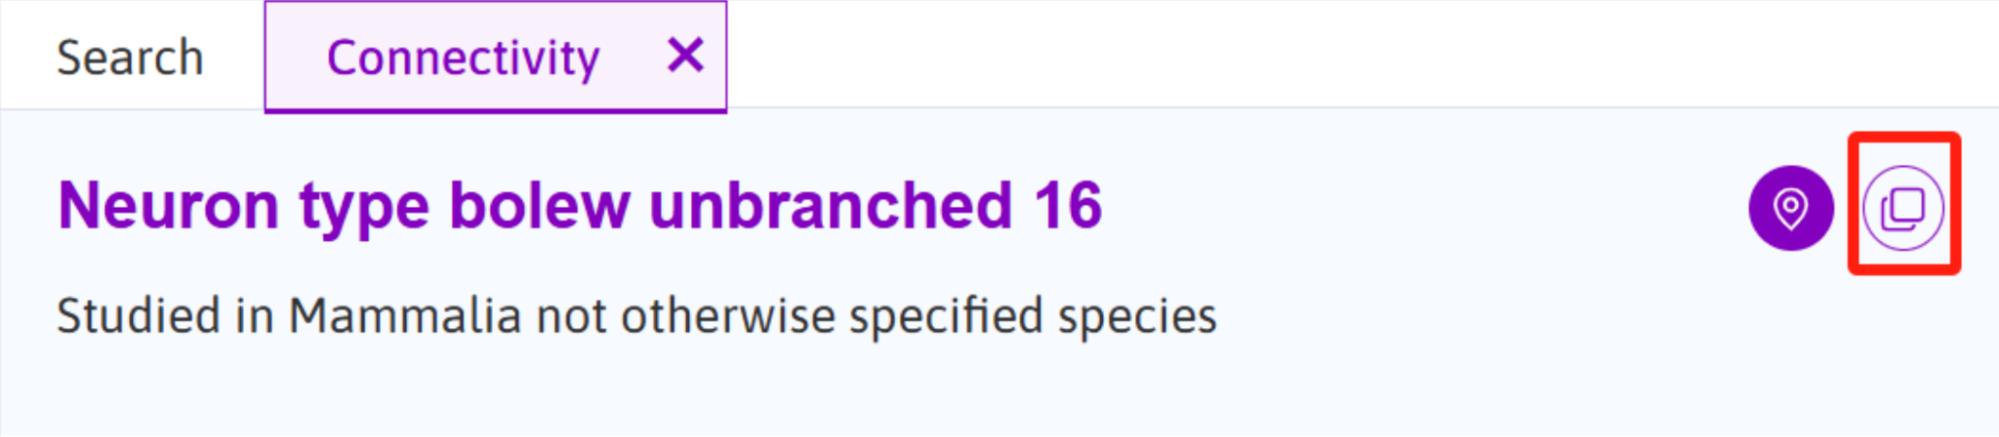
The clipboard icon in the top right corner of the sidebar.
References
Hovering on the reference title in the sidebar, a clipboard icon will appear next to the reference title. Click it to copy only the reference list displayed below in the currently selected citation format.

The clipboard icon appears next to the References title.
Individual references can be copied by using the clipboard icon that appears when hovering over the reference of interest.

The clipboard icon appears at the bottom right corner of the individual references when hovered.
Updated about 1 year ago