Plot Viewer
The SPARC Portal's plot viewer provides a web preview of tabular data.
To navigate through to the Plot Viewer:
- Click
Data & Modelsfrom the main menu. - All the datasets are listed under the
Datasetstab. - Enter a search term to search for a dataset, for example
DOI: 10.26275/z6jn-j5tx: Transcriptional diversity of single neurons in the porcine right atrial ganglionic plexus (RAGP). Click theSearchbutton. - Choose the dataset you want to explore by clicking on the
dataset title.
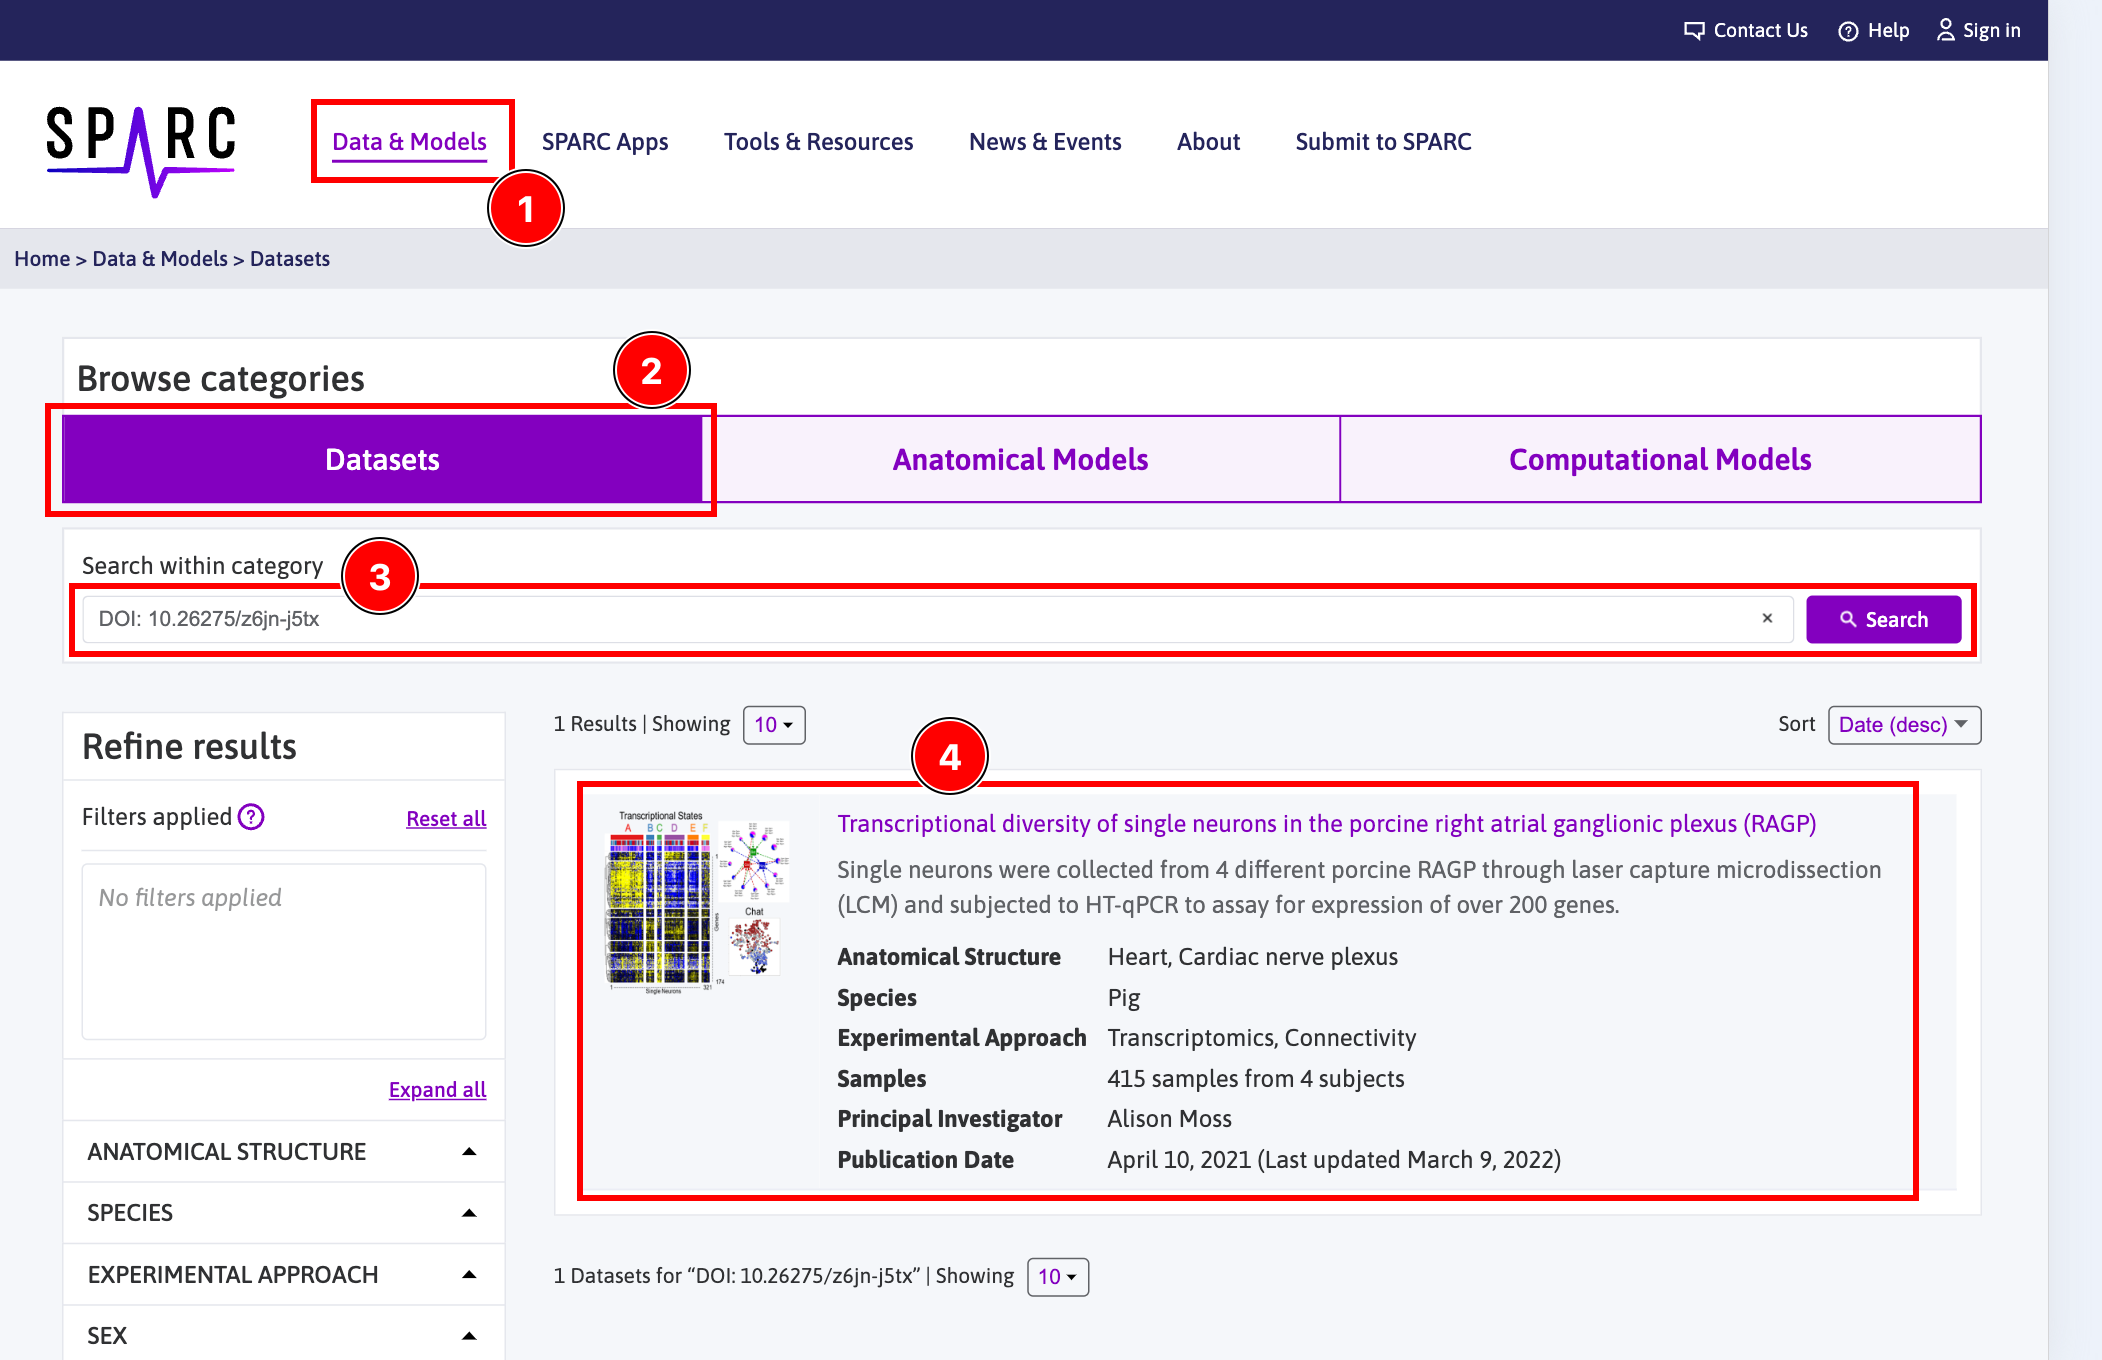
Figure 1: SPARC Find Data page with annotations illustrating how a search for a dataset with a plot may be performed.
On the Dataset's page:
- Select the
Gallerytab to view thumbnails of the microscopy image data accompanied by plot, segmentation, anatomical scaffolds, and flatmaps for the current dataset. - Click on
View Plot.
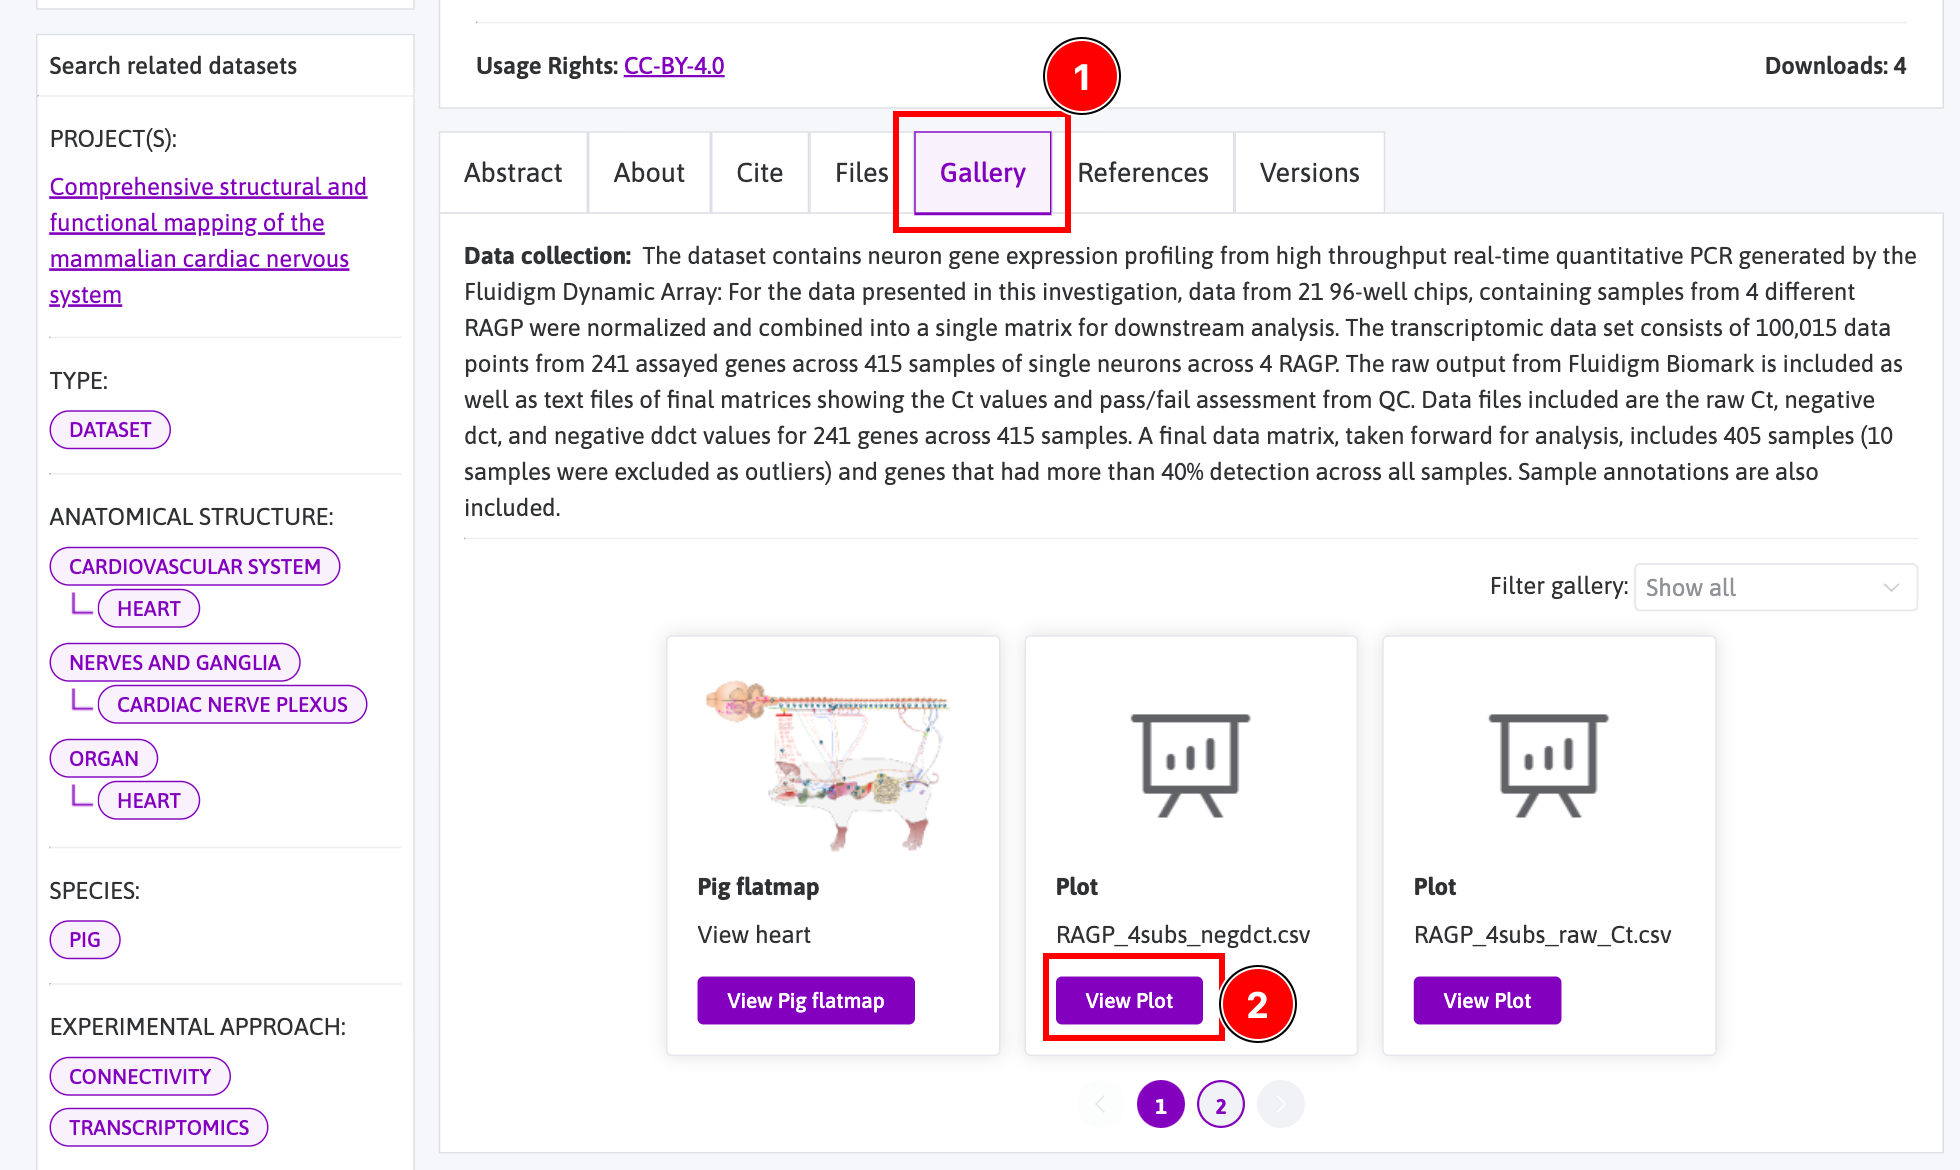
Figure 2: Section of a dataset page showing the Gallery tab, with annotations illustrating how to navigate to viewing a plot from the dataset.
Use the following controls to interact with the plot viewer:
- Click and drag will create a
zoom windowto look at a sub-part of the plot. Zoom inandzoom outof the model by scrolling with the mouse wheel.- Filter the x and y axis content with the selection chooser elements and the
Filter plotbutton. - Manually modify the zoom state with the zoom buttons. The buttons
zoom in,zoom out, andresetthe zoom.
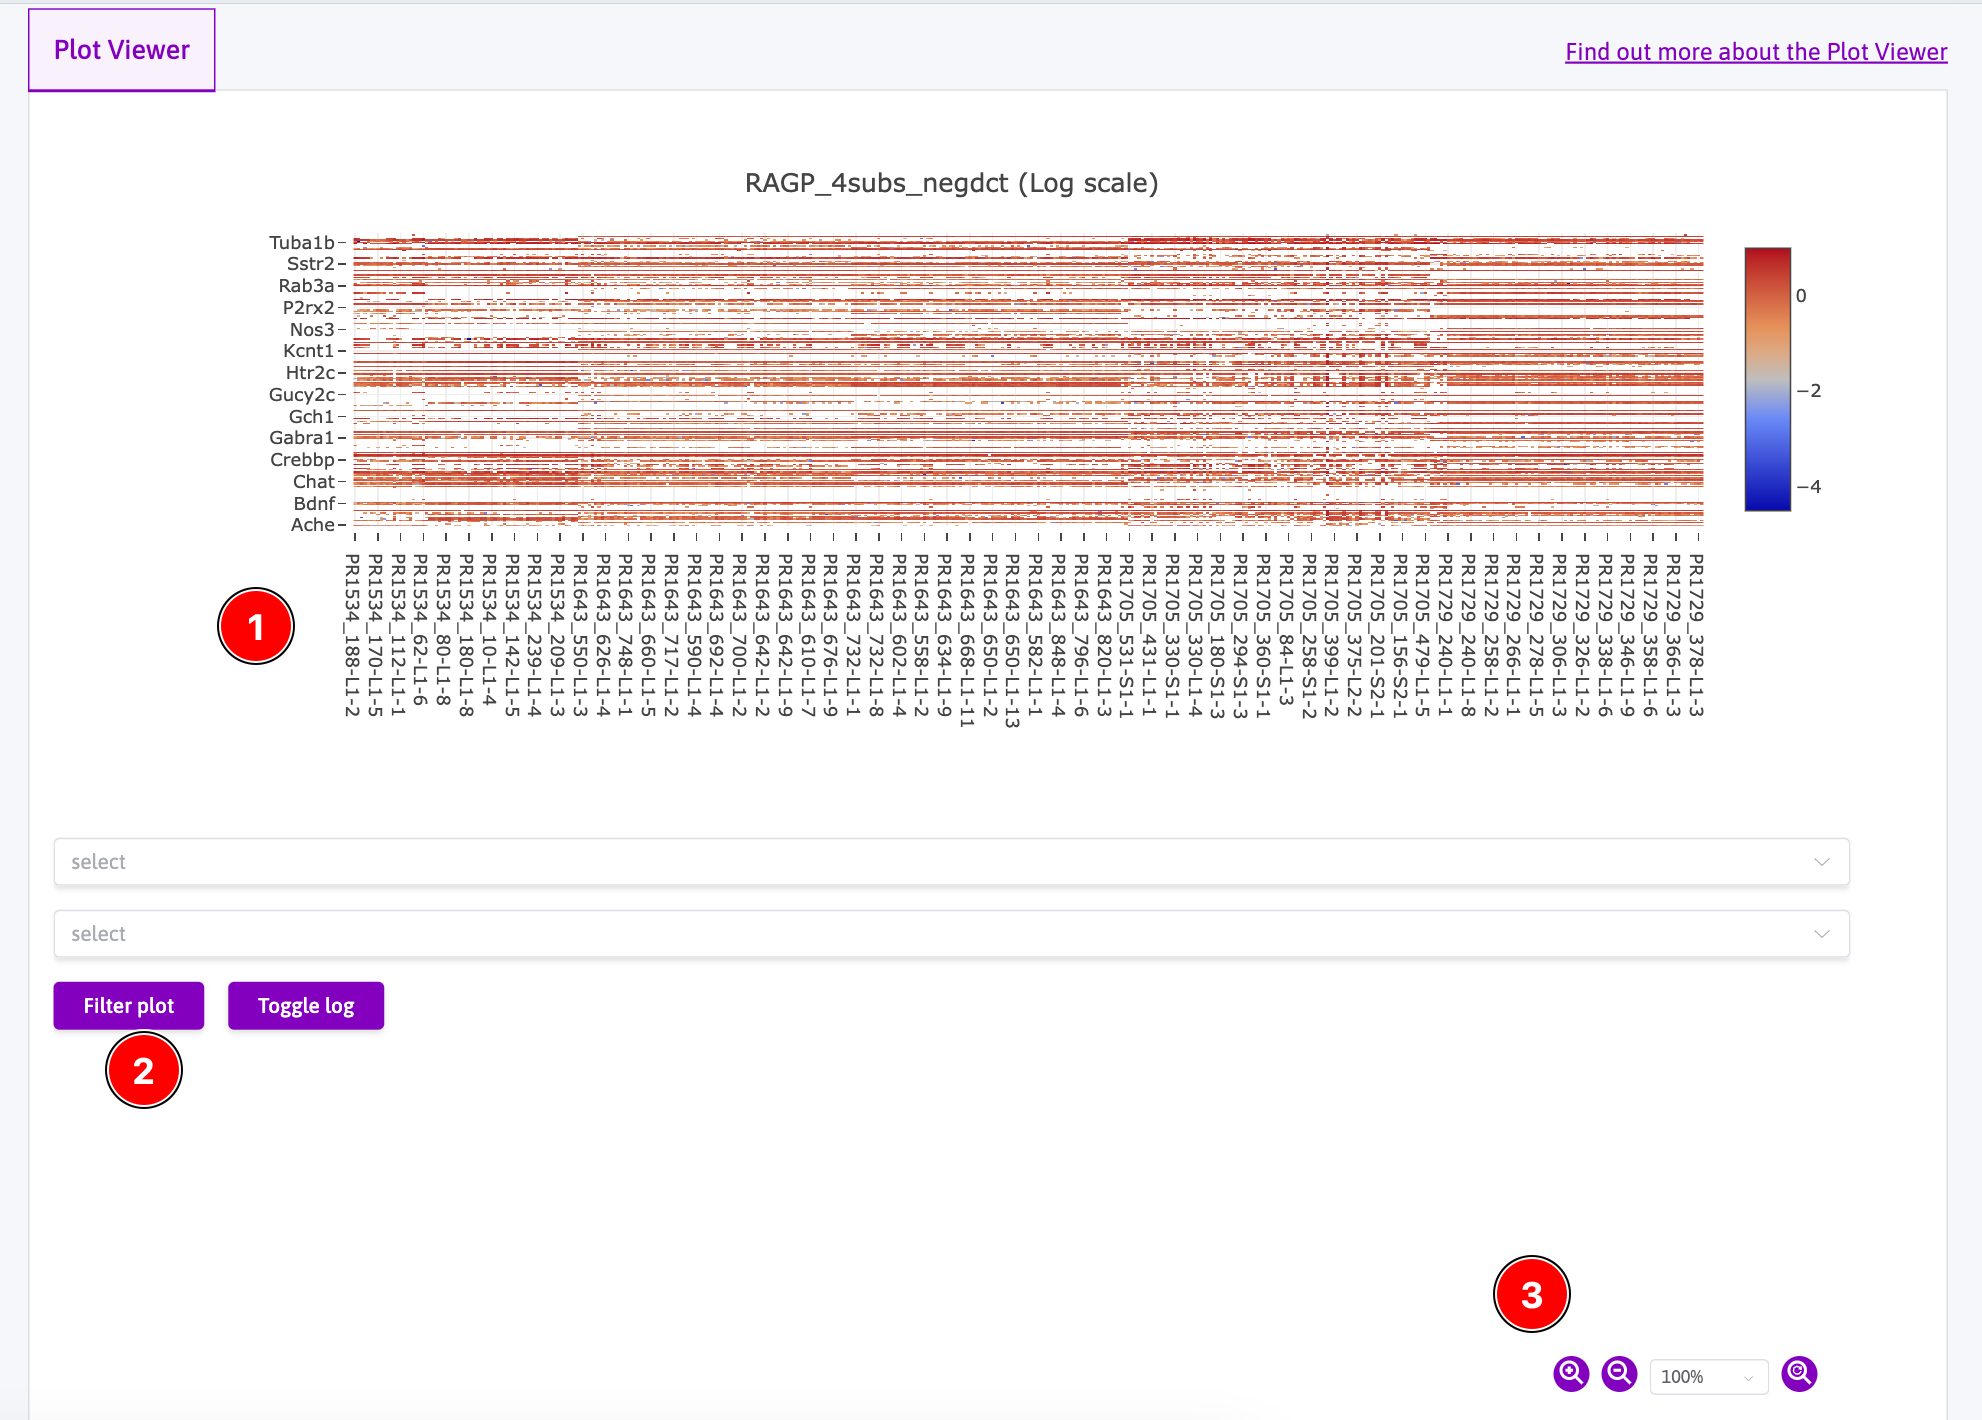
Figure 3: (1) Main plot window, click and drag to zoom to area, middle mouse zooms in and out. (2) Select elements to choose to view only selected row or column values, Filter plot button activates current selection. (3) Manual zoom controls: zoom in, out, and reset.
Below the plot viewer, file-level metadata is provided and a Download file button to download the file.
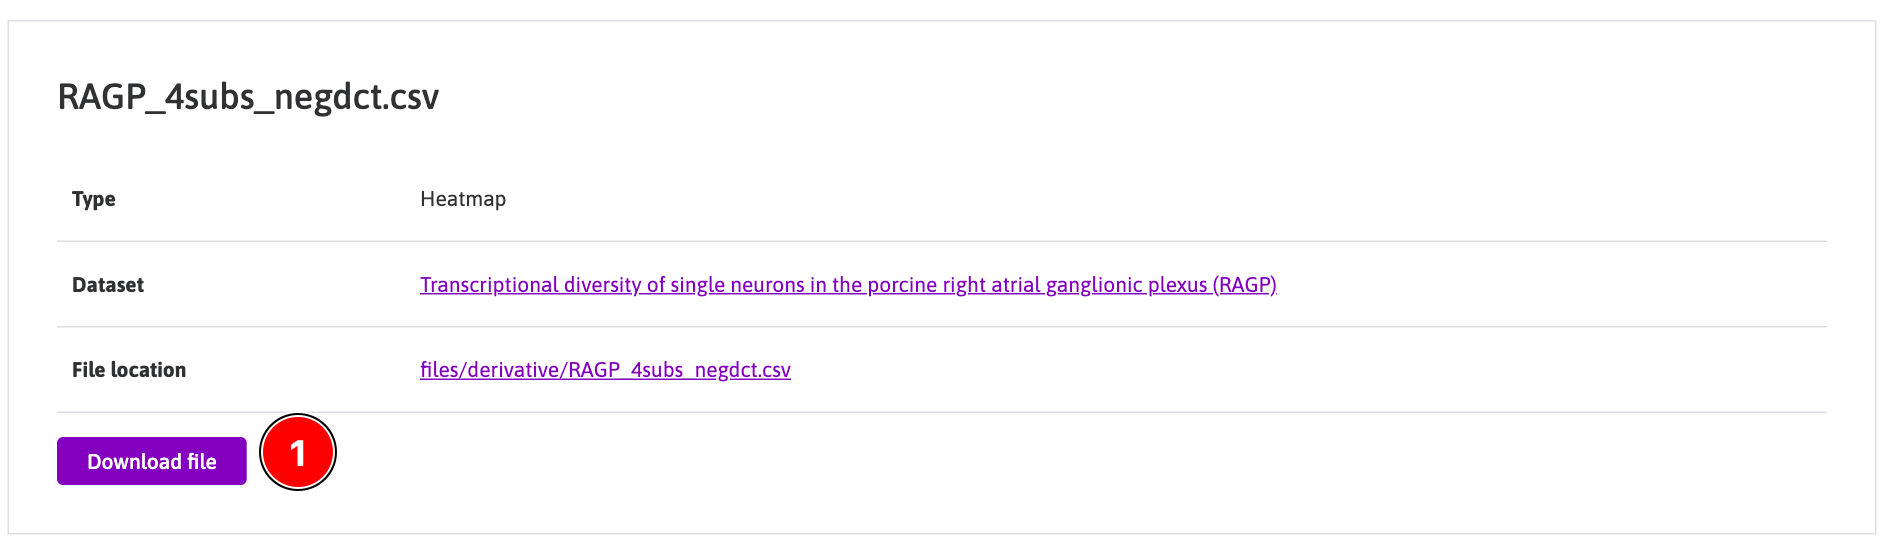
Figure 4: Plot viewer summary table, annotated illustrating the Download file button.
Updated about 1 year ago