Functional Connectivity Maps
Using the Functional Connectivity (FC) maps on the SPARC Portal
An FC map represents a well defined collection of physiology (i.e., function) and includes one or more simulation experiments enabling exploration of key aspects of the physiology combined with visual representation(s) presented as interactive flatmaps. Simulation experiments are integrated in FC maps as COMBINE archive files, which can be interactively executed in the browser using the simulation viewer. Learn more about Flatmaps and how to access them and see Figure 1 for an example FC map.
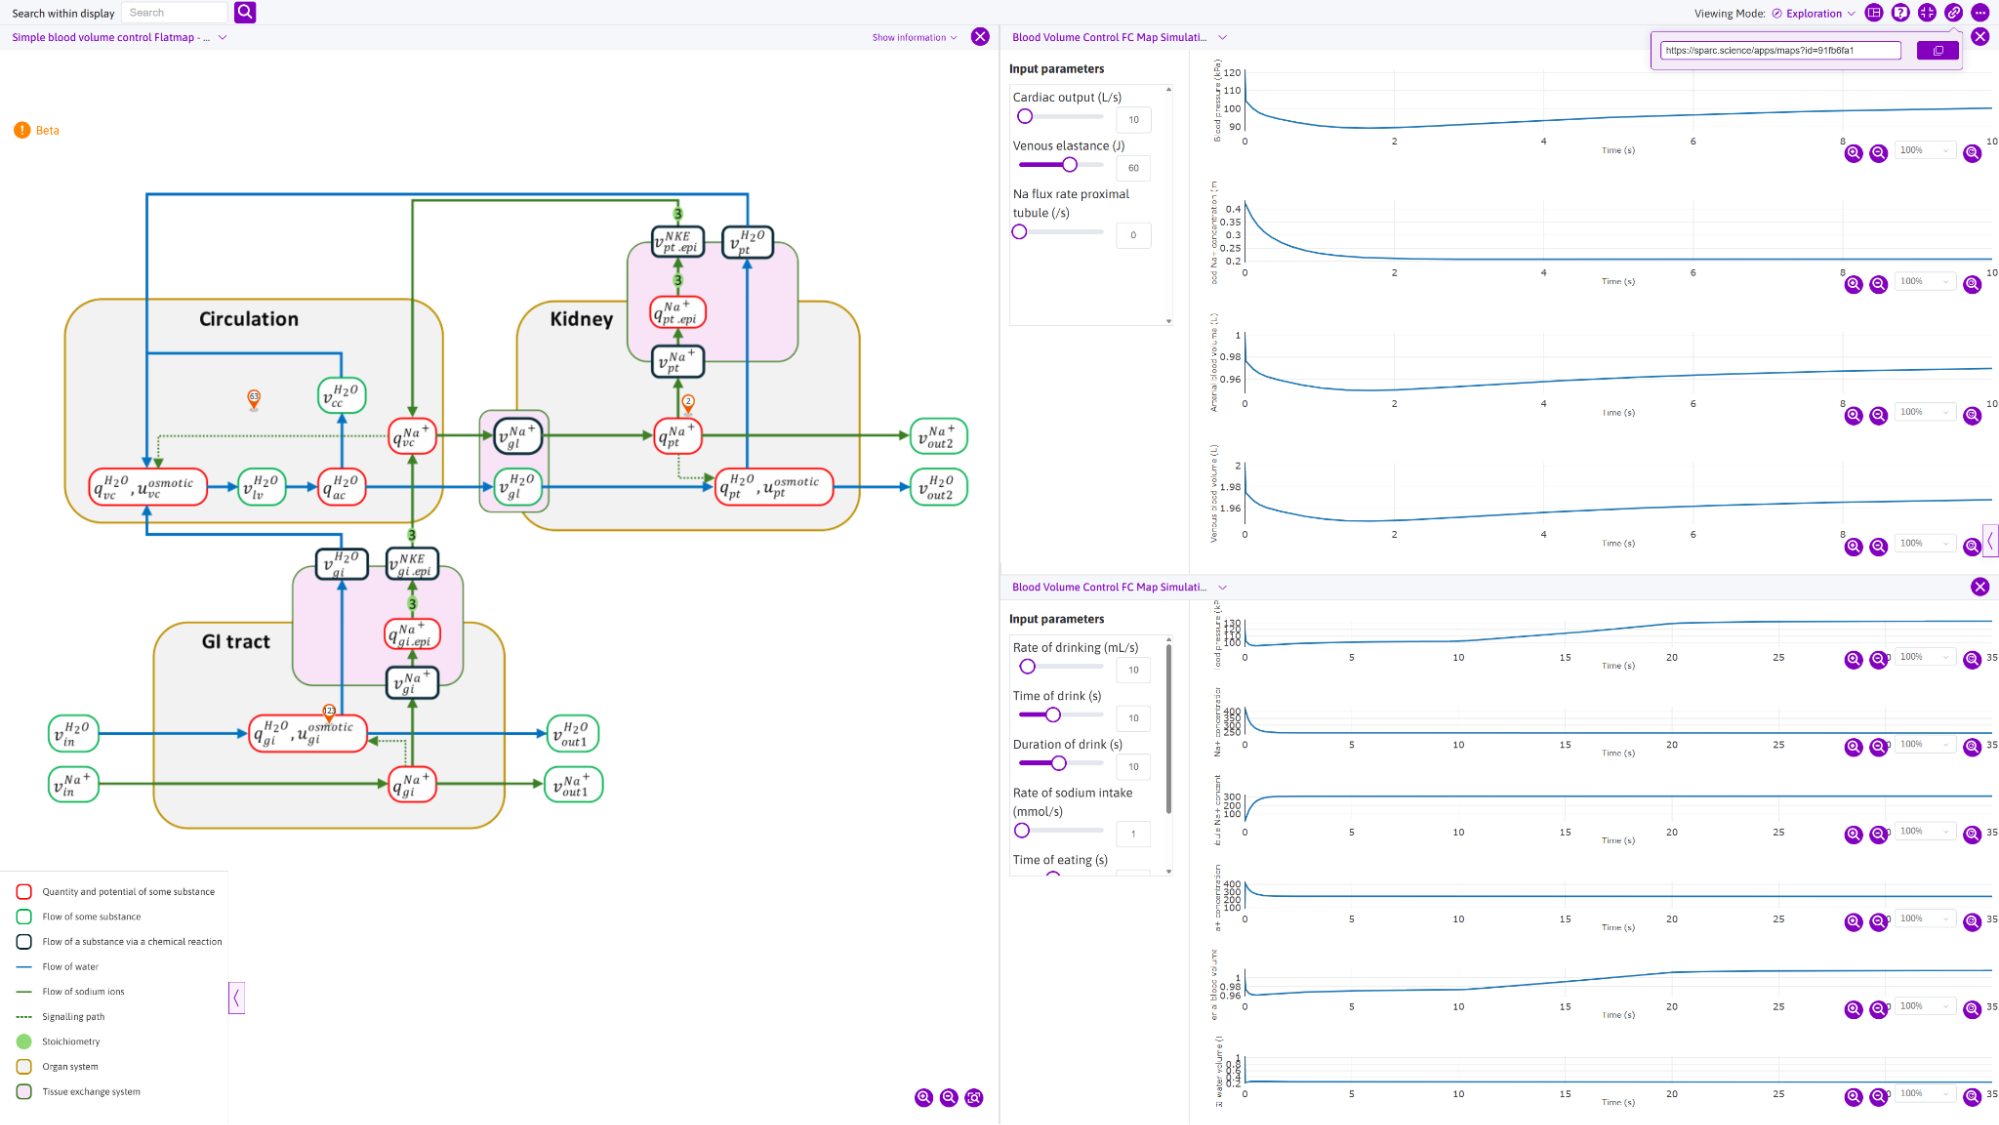
Figure 1: An example Functional Connectivity (FC) map, published on the SPARC Portal as https://doi.org/10.26275/mf4h-kzbs. Here we show the FC map (and corresponding legend) on the SPARC Portal flatmap viewer along with the associated simulation experiments - this view can be directly obtained by visiting this permalink: https://sparc.science/apps/maps?id=91fb6fa1
Exploring FC maps on the SPARC Portal
FC maps are published to the SPARC Portal as datasets. An FC map dataset contains the visual maps and executable simulation experiments such that they are discoverable from both the dataset browser and the maps sidebar dataset explorer.
FC maps in the dataset browser
In the SPARC Portal dataset browser, FC map datasets can be found in the “Computational Models” category. You can search across the datasets as shown in Figure 2, using text or the various dataset facets.
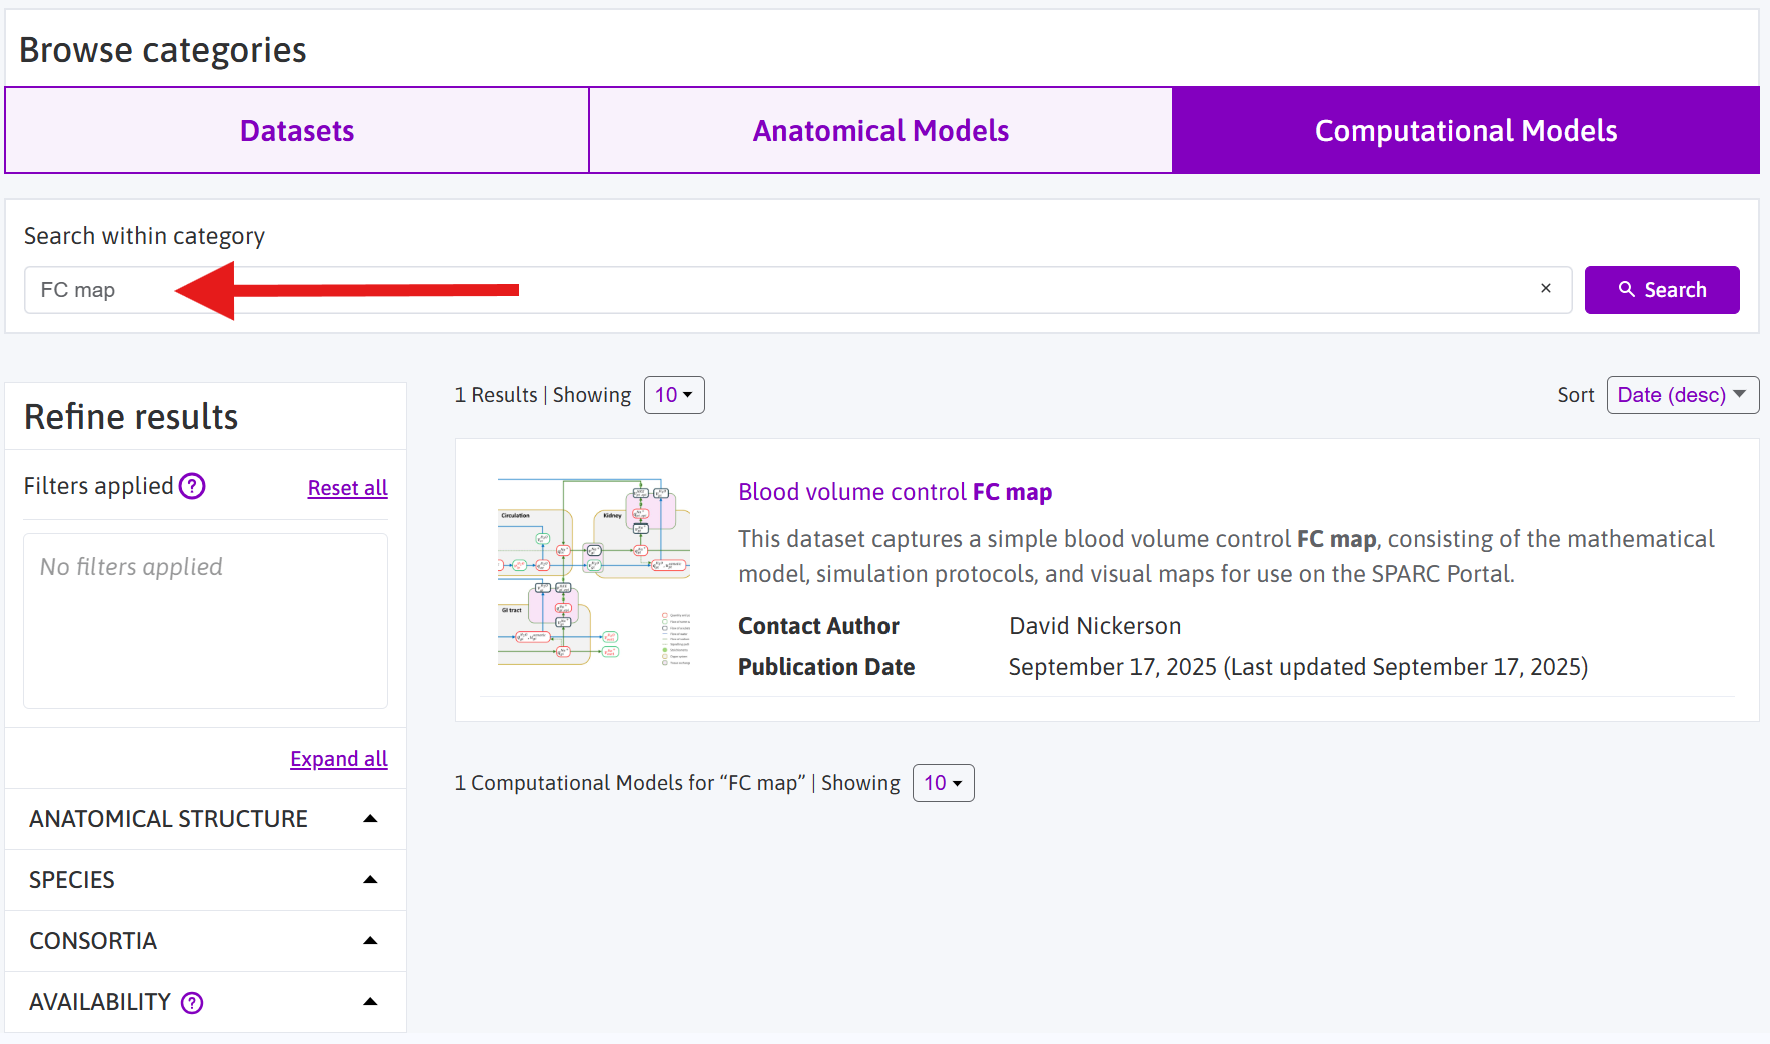
Figure 2: The Computational Models category of datasets published on the SPARC Portal. You can search using text strings and/or the various facets available. The “anatomical structure” facet may be particularly useful for exploring FC maps relevant to specific anatomical structures.
Having located the FC map dataset of interest, the dataset landing page provides detailed information about the dataset (and the FC map). Further details on exploring the dataset details are available here. For the purposes of exploring the FC map, the dataset gallery offers the best overview.
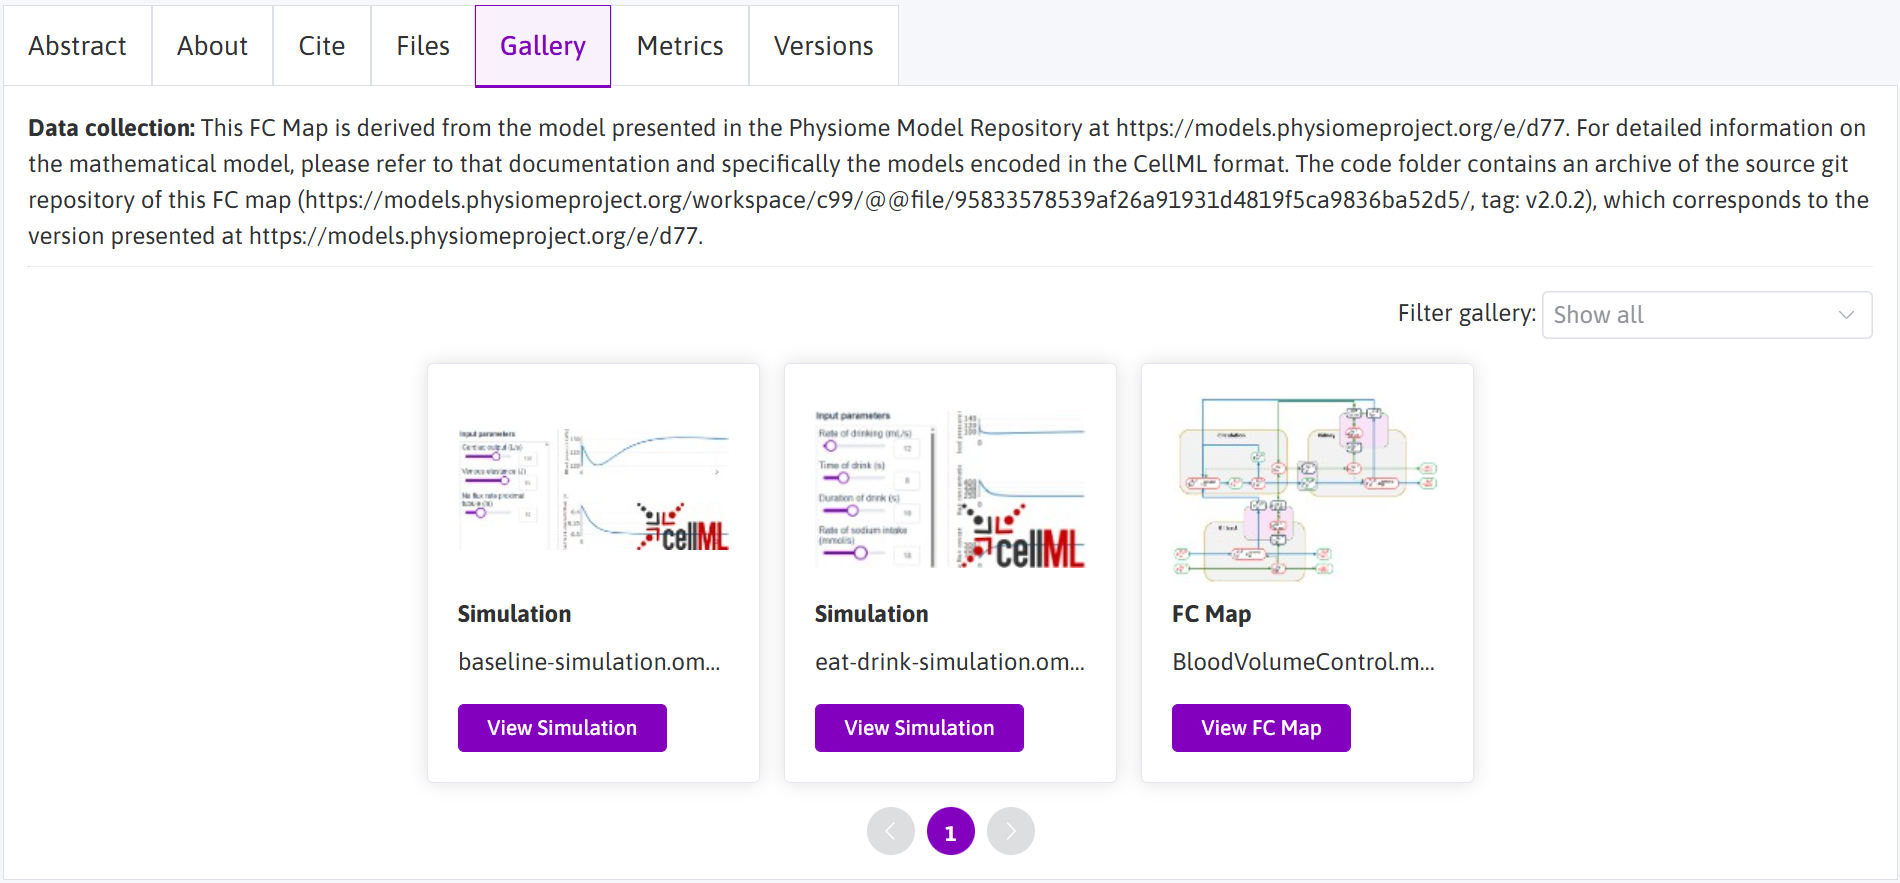
Figure 3: The dataset gallery for dataset https://doi.org/10.26275/mf4h-kzbs. Of particular interest are the simulation experiments and the flatmap, each of which can be launched in the appropriate viewer.
From the dataset gallery, the available simulation experiments can be launched in the simulation viewer by selecting the desired simulation experiment. Similarly, the available flatmaps can be launched in the portal flatmap viewer for interactive exploration. See the portal maps viewer documentation for details on how to use the viewer.
FC maps in the maps sidebar dataset explorer
In the SPARC Portal maps viewer, the dataset explorer can be used to discover FC maps. Full information can be found in the sidebar documentation, with an example shown in Figure 4.
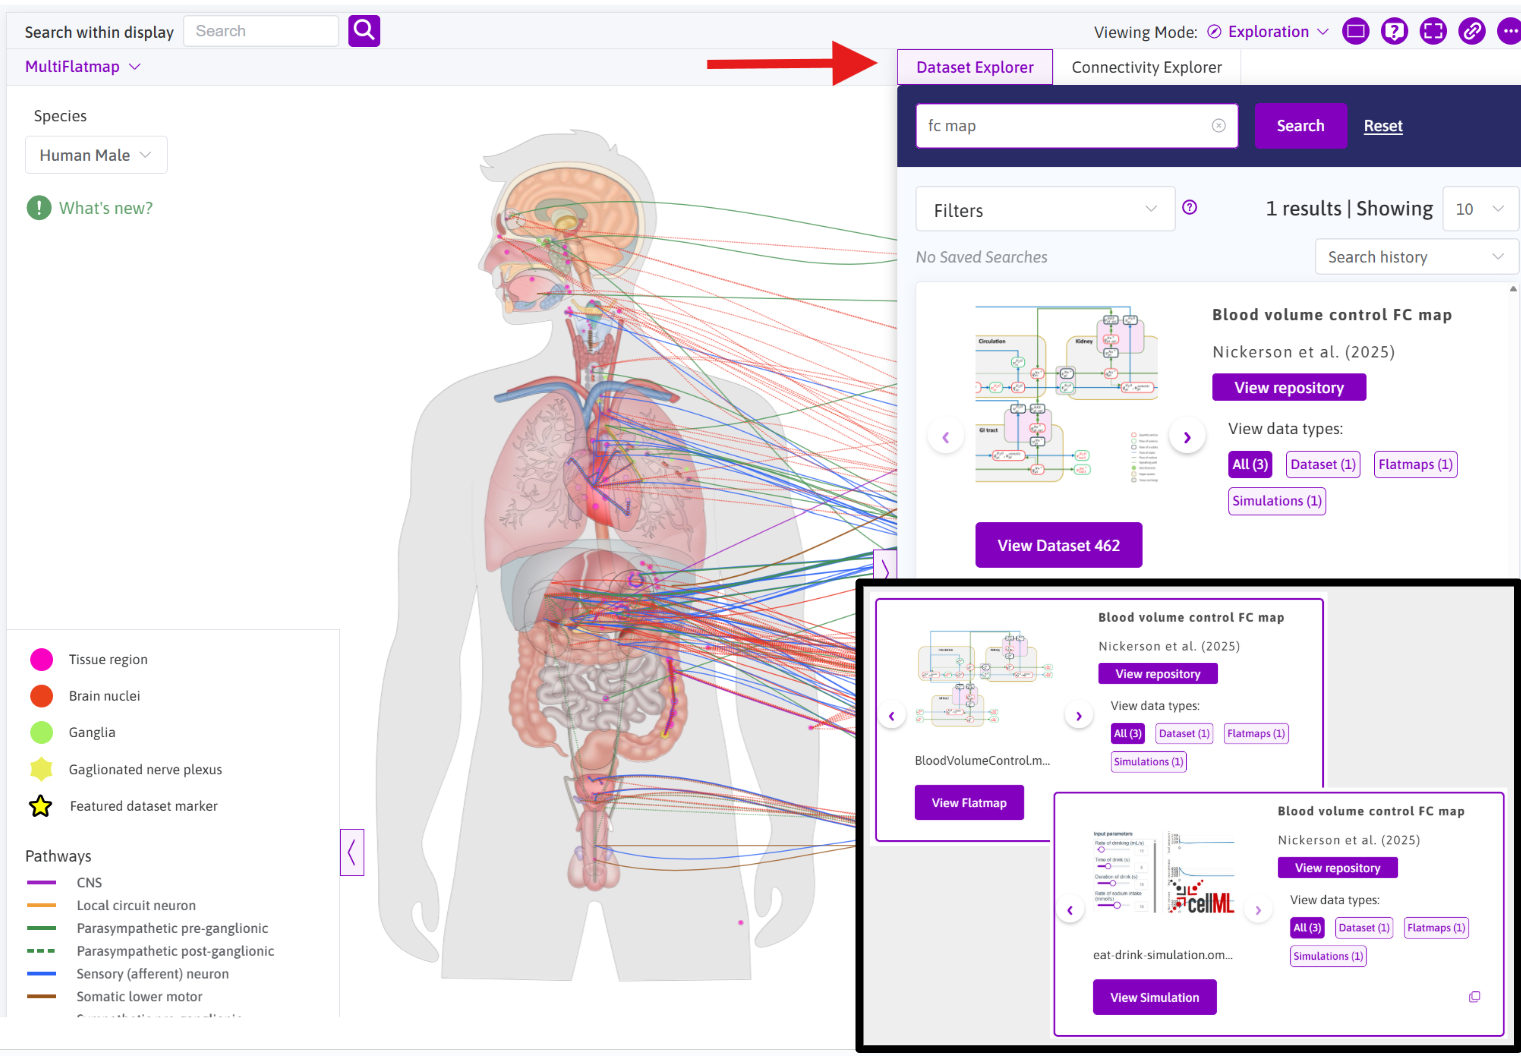
Figure 4: A screenshot showing an example of exploring “fc map” datasets and browsing the resources available for the FC map dataset shown. Inset panel shows the use of the dataset card gallery viewer to explore the different resources and the corresponding viewer launch buttons.
The definition of an FC map dataset
As described above, an FC map represents a well defined collection of physiology with one or more simulation experiments enabling exploration of key aspects of the physiology combined with visual representation(s) presented as interactive flatmaps. FC maps are published as SPARC datasets on the Portal, and the source data, models, and knowledge from which the dataset is generated is archived in the associated workspace on the Physiome Model Repository (PMR).
Simulation experiments in an FC map dataset are stored as COMBINE archive files. Each COMBINE archive file contains all required data and knowledge to enable reproducible execution of the described simulation experiment as well as the information needed to configure the portal simulation viewer to enable users to explore the behaviour of the associated model(s). The mathematical model(s) are encoded in the CellML standard and the simulation settings in the SED-ML standard. All the “source” CellML and SED-ML documents, as well as the simulation viewer configurations and descriptions of the COMBINE archive files are archived in PMR and used to generate the COMBINE archive files to include in the FC map dataset when populating the dataset.
In addition to the simulation experiments, the PMR workspace for an FC map also includes the source files for the relevant flatmaps. These sources are the flatmap components for the source anatomical diagrams and annotations. As described, this flatmap source information is used to generate the actual flatmap(s) on the Portal’s flatmap server. The knowledge of the generated map is included in the FC map dataset to enable the portal map viewer to display the flatmap(s) for each FC map dataset. As these flatmaps need to be available from the Portal’s flatmap server, special permission is required to make the maps available. For any users wanting to publish their own FC map datasets, you will need to contact us.
Updated 9 months ago