3D Whole Body Map
3D Whole Body Map Interface
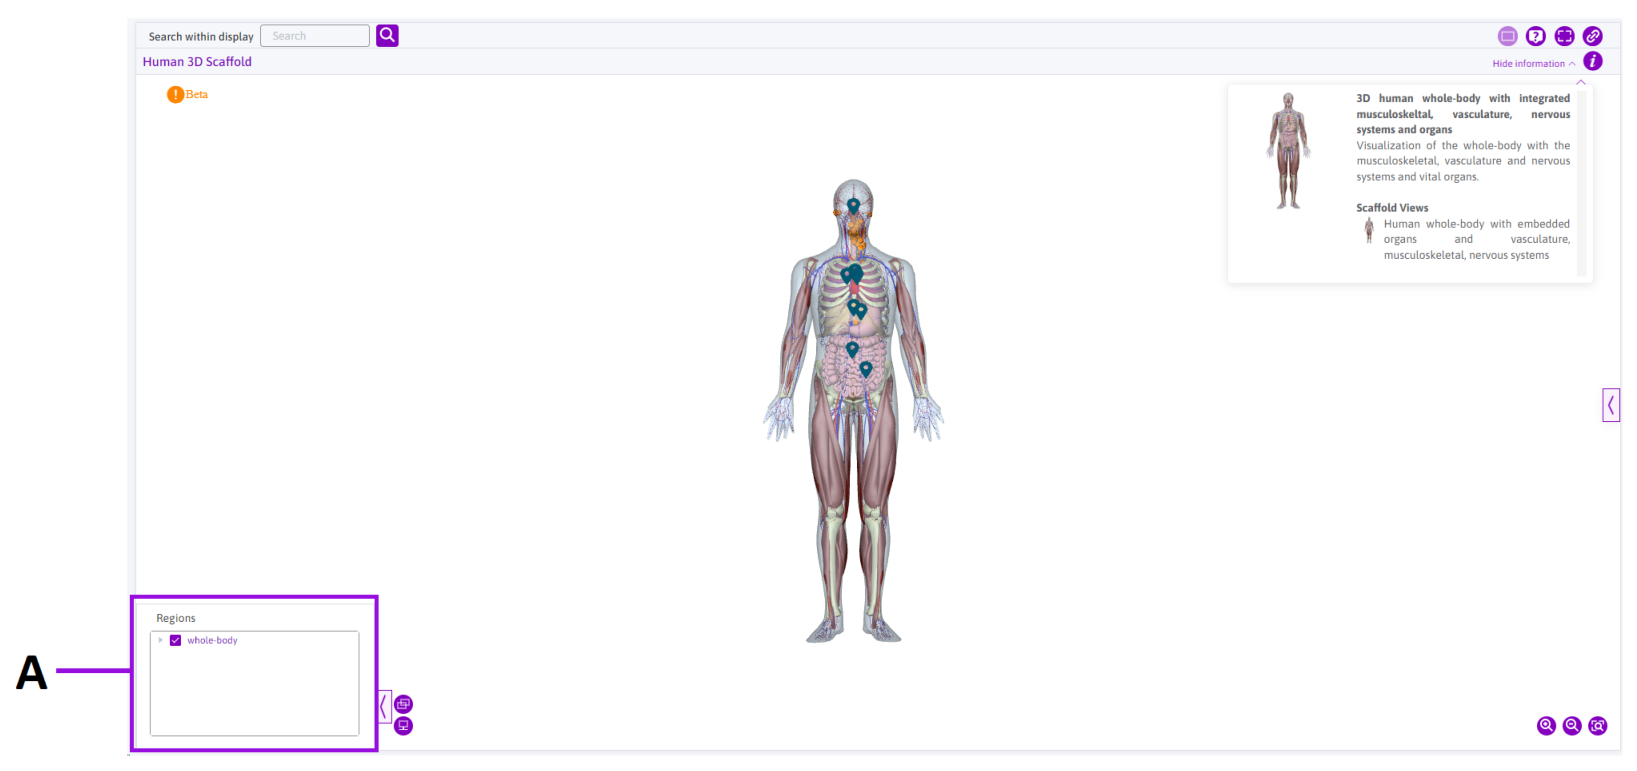
Figure 7: The 3D whole-body map interface.
A: Map regions interface
The regions of the 3D whole-body map can be identified and filtered in this area. Clicking the whole-body dropdown reveals all systems available for visualization.
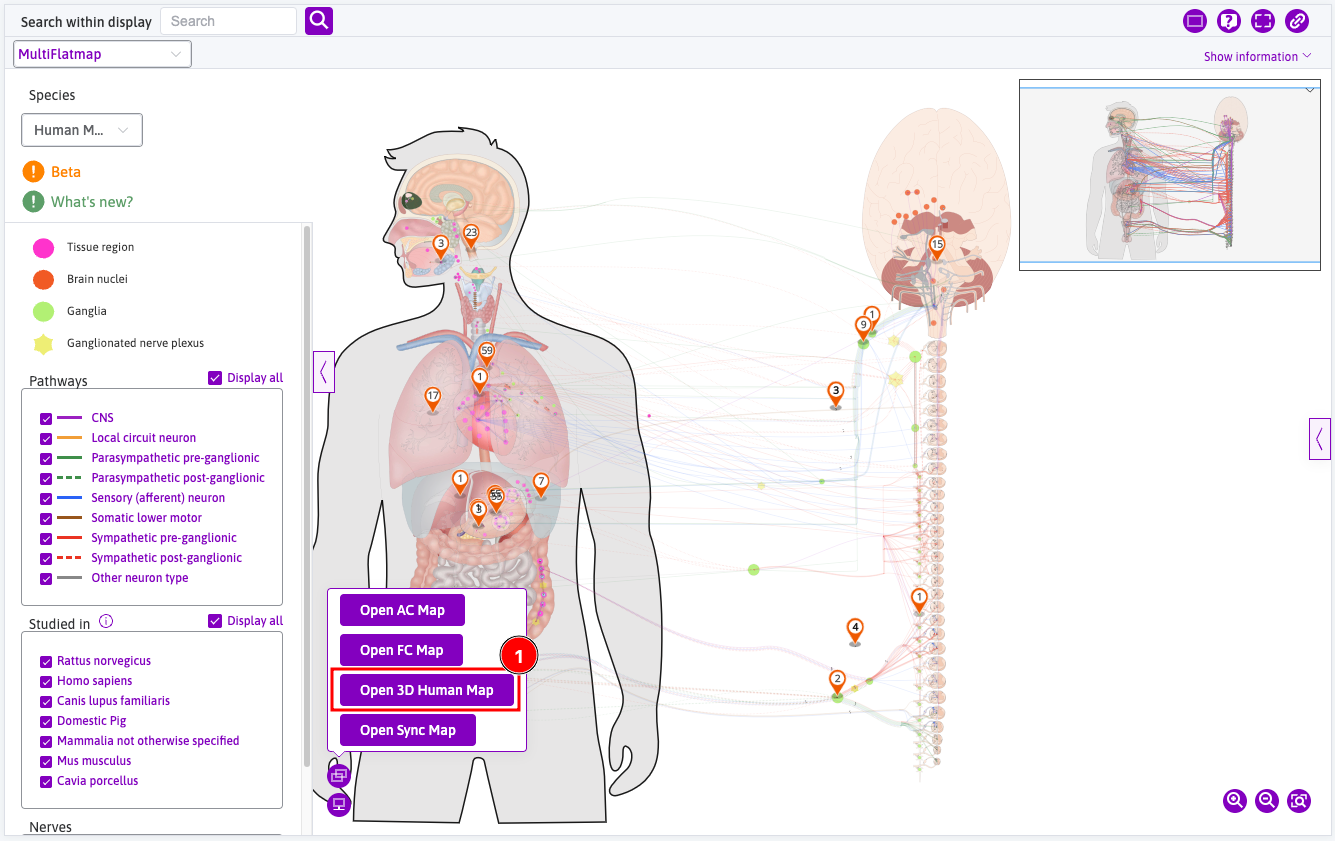
Opening 3D Maps
3D maps can be opened from the Open new map tooltip from the Integrated Maps Viewer and AC Flatmap
- Click the
Open 3D Human Mapto open the 3D Human Map in the full map area. - Click on the
Open Sync Mapto open the 3D map viewer in split screen; - The corresponding 3D version is linked with the flatmap by default, or it can be unlinked independently from one another.
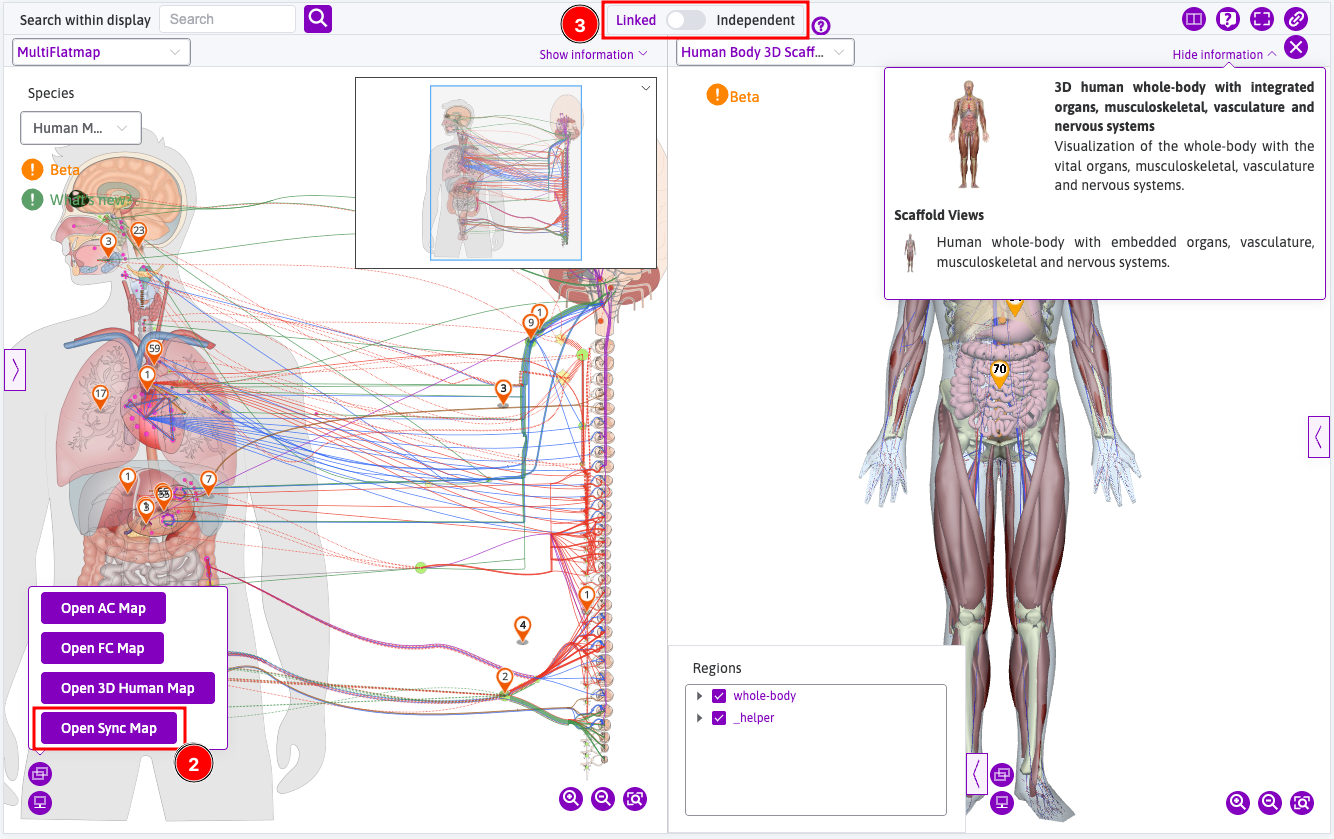
- The corresponding 3D version is linked with the flatmap by default, or it can be unlinked independently from one another.

Updated about 1 year ago
Did this page help you?