Controls
Anatomical Connectivity (AC) FlatmapVuer
From introduction to Maps: https://docs.sparc.science/v1.0/update/docs/introduction-to-maps#/
seems too similar to Integrated Map Viewer: https://docs.sparc.science/v1.0/update/docs/integrated-maps-viewer-overview#/
please pick one or, preferably, combine!
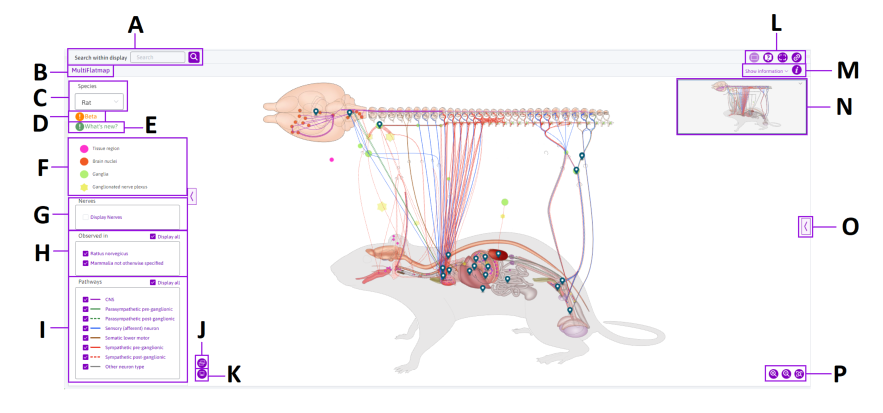
AC Flatmap Interface Controls
Maps Interface Controls
A: Search bar
Features in the flatmap, including organs, tissues, nerves and ganglia, can be searched for in the search box.
B: The title of the currently viewed map/scaffold
When multiple maps/scaffolds have been opened, a drop-down menu is displayed that allows the currently displayed flatmap/scaffold to be changed.
C: Species
The dropdown names the species currently viewed in the flatmap. Use the dropdown to change the species displayed in the flatmap.
D: Beta tag
This will often appear in maps that are currently under development.
E: What’s new?
Hovering over the What’s new? provides information relating to the latest updates to the SPARC Portal maps.
F: Flatmap legend
The legend provides generic information on what the features in the flatmap represent. Hovering over these features will display the specific feature that is represented.
G: Nerves toggle
This toggle allows hand-drawn nerves to be visualised. By default, these nerves are hidden. These nerves are based on information found in SCKAN.
H: Observed species toggle
This toggle allows filtering of features that are found in either Rattus Norvegicus (i.e. the common rat) or generally in mammals.
I: Neural pathways interface
The pathways visualised in the flatmap can be controlled in this area. By interacting with the tick boxes, specific pathways can be hidden. Both the legend and pathways interface can be hidden by using the arrow to the left.
J: Open new map
This icon allows the user to open a new map. Refer to the Working with Multiple Views in Maps documentation for more information.
K: Display settings
The display of the flatmap can be manipulated by clicking the computer icon. This prompts an interface that allows the user to change the viewing mode, organs and outlines display, and the background color.
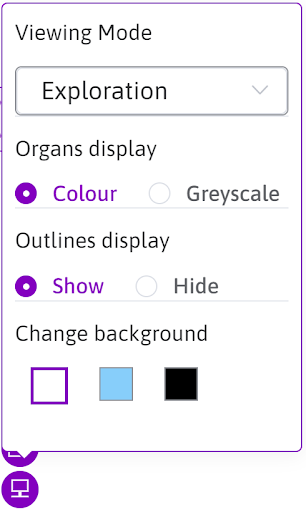
Display settings interface allows manipulation of the flatmap visualization
The Viewing Mode selector in the Display settings dialog (Figure) has three options:
Note:Refer to the SPARC Portal Annotation Tool documentation for more information on the Viewing Mode setting.
K1. Exploration: clicking on a path presents a pop up showing the components of the path which can be used in a search query.
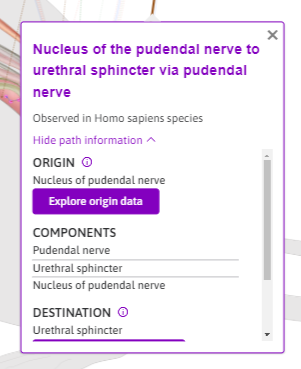
Exploration Mode: after selecting a path
K2. Network Discovery: clicking on a path will highlight the targeted path and paths connected to it.
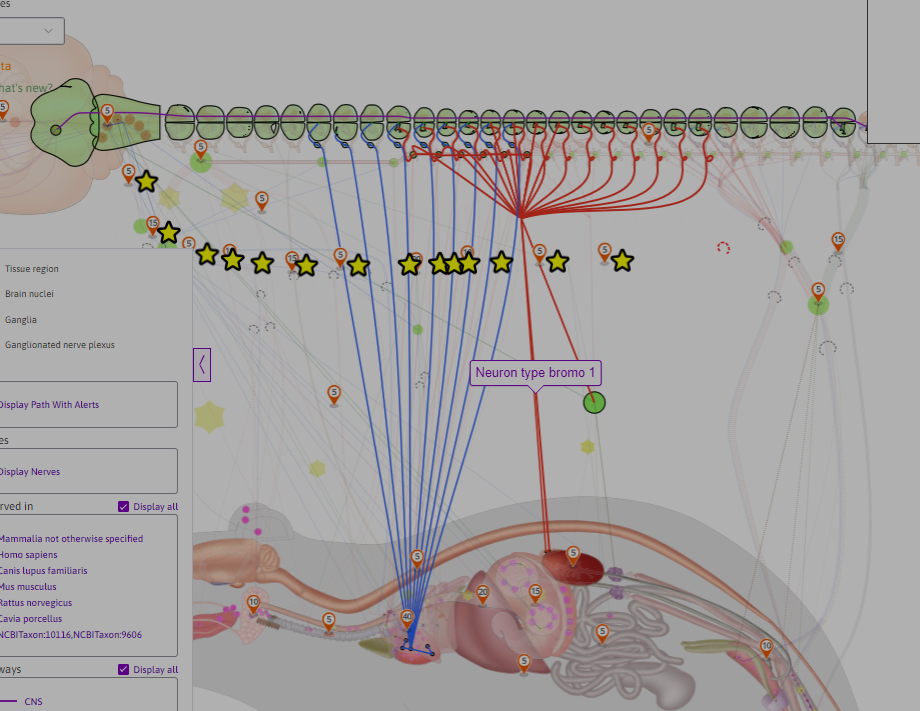
Network Discovery Mode: Highlighting nearby pats to the one selected
K3. Annotation (Login only): annotations can be added to a selected path. Annotations created in this way will only be viewable by others once the annotation is approved
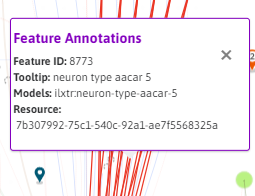
Annotation Mode: Viewing the annotations of a path (non-user generated)
L: Flatmap controls and help
- Split Screen - Clicking this button allows the user to view multiple maps/scaffolds at once. The multi-flatmap view can also be configured here. For more information refer to the Working with Multiple Views in Maps documentation.
- Help - Clicking this button prompts support boxes throughout the map/scaffold display to provide further information on the features.
- Fullscreen - Clicking this button allows a fullscreen display of the map/scaffold.
- Permalink - Clicking this button generates a permalink to the current version and orientation of the map/scaffold display.
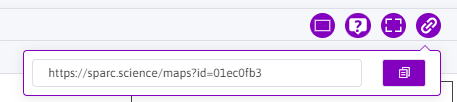
The generated permalink to the current version and orientation of the map/scaffold display.
M: Display information
Clicking Show information or on the icon will visualize information on the currently displayed map or scaffold.
N: The Overview Panel
The current location of the user with respect to the full view of the flatmap can be seen here. As the map is manipulated, a blue box indicates what region of the flatmap is being viewed.
O: The Map Sidebar
The chevron on the right-hand side of the map interface opens the sidebar. Here datasets, maps, and scaffolds can be accessed. For more information, refer to the
How to use the sidebar in maps documentation.
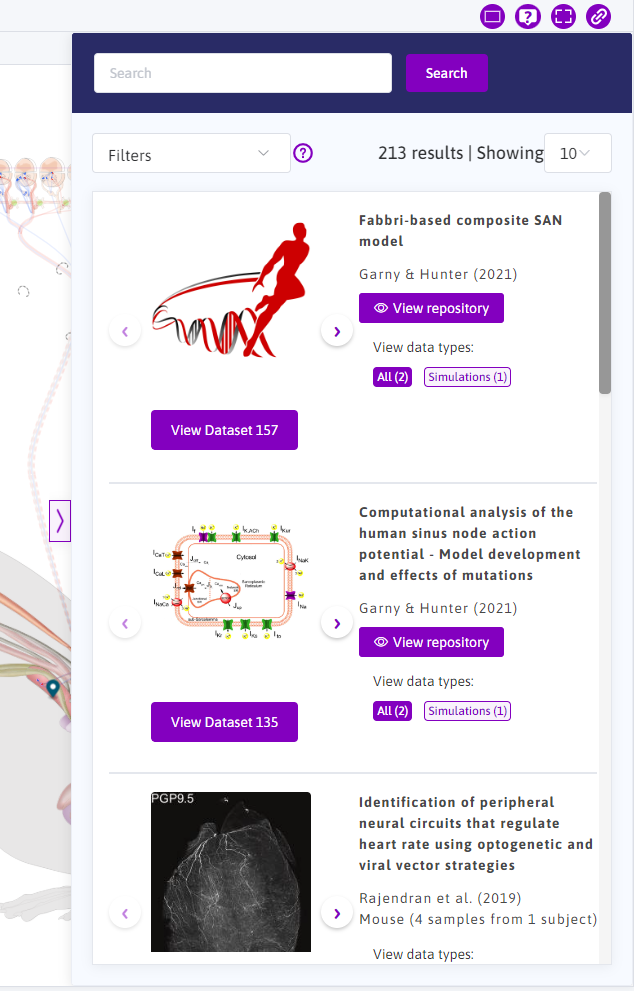
The map sidebar. Datasets, scaffolds and more can be accessed here. Clicking on features in the flatmap prompts the sidebar with related information.
P: Zoom controls of the interface
The zoom level of the map/scaffold being currently viewed can be manipulated with these controls. The right-most button allows a fit-to-window display. Note that zooming in/out can also be achieved by scrolling.
Updated 10 months ago